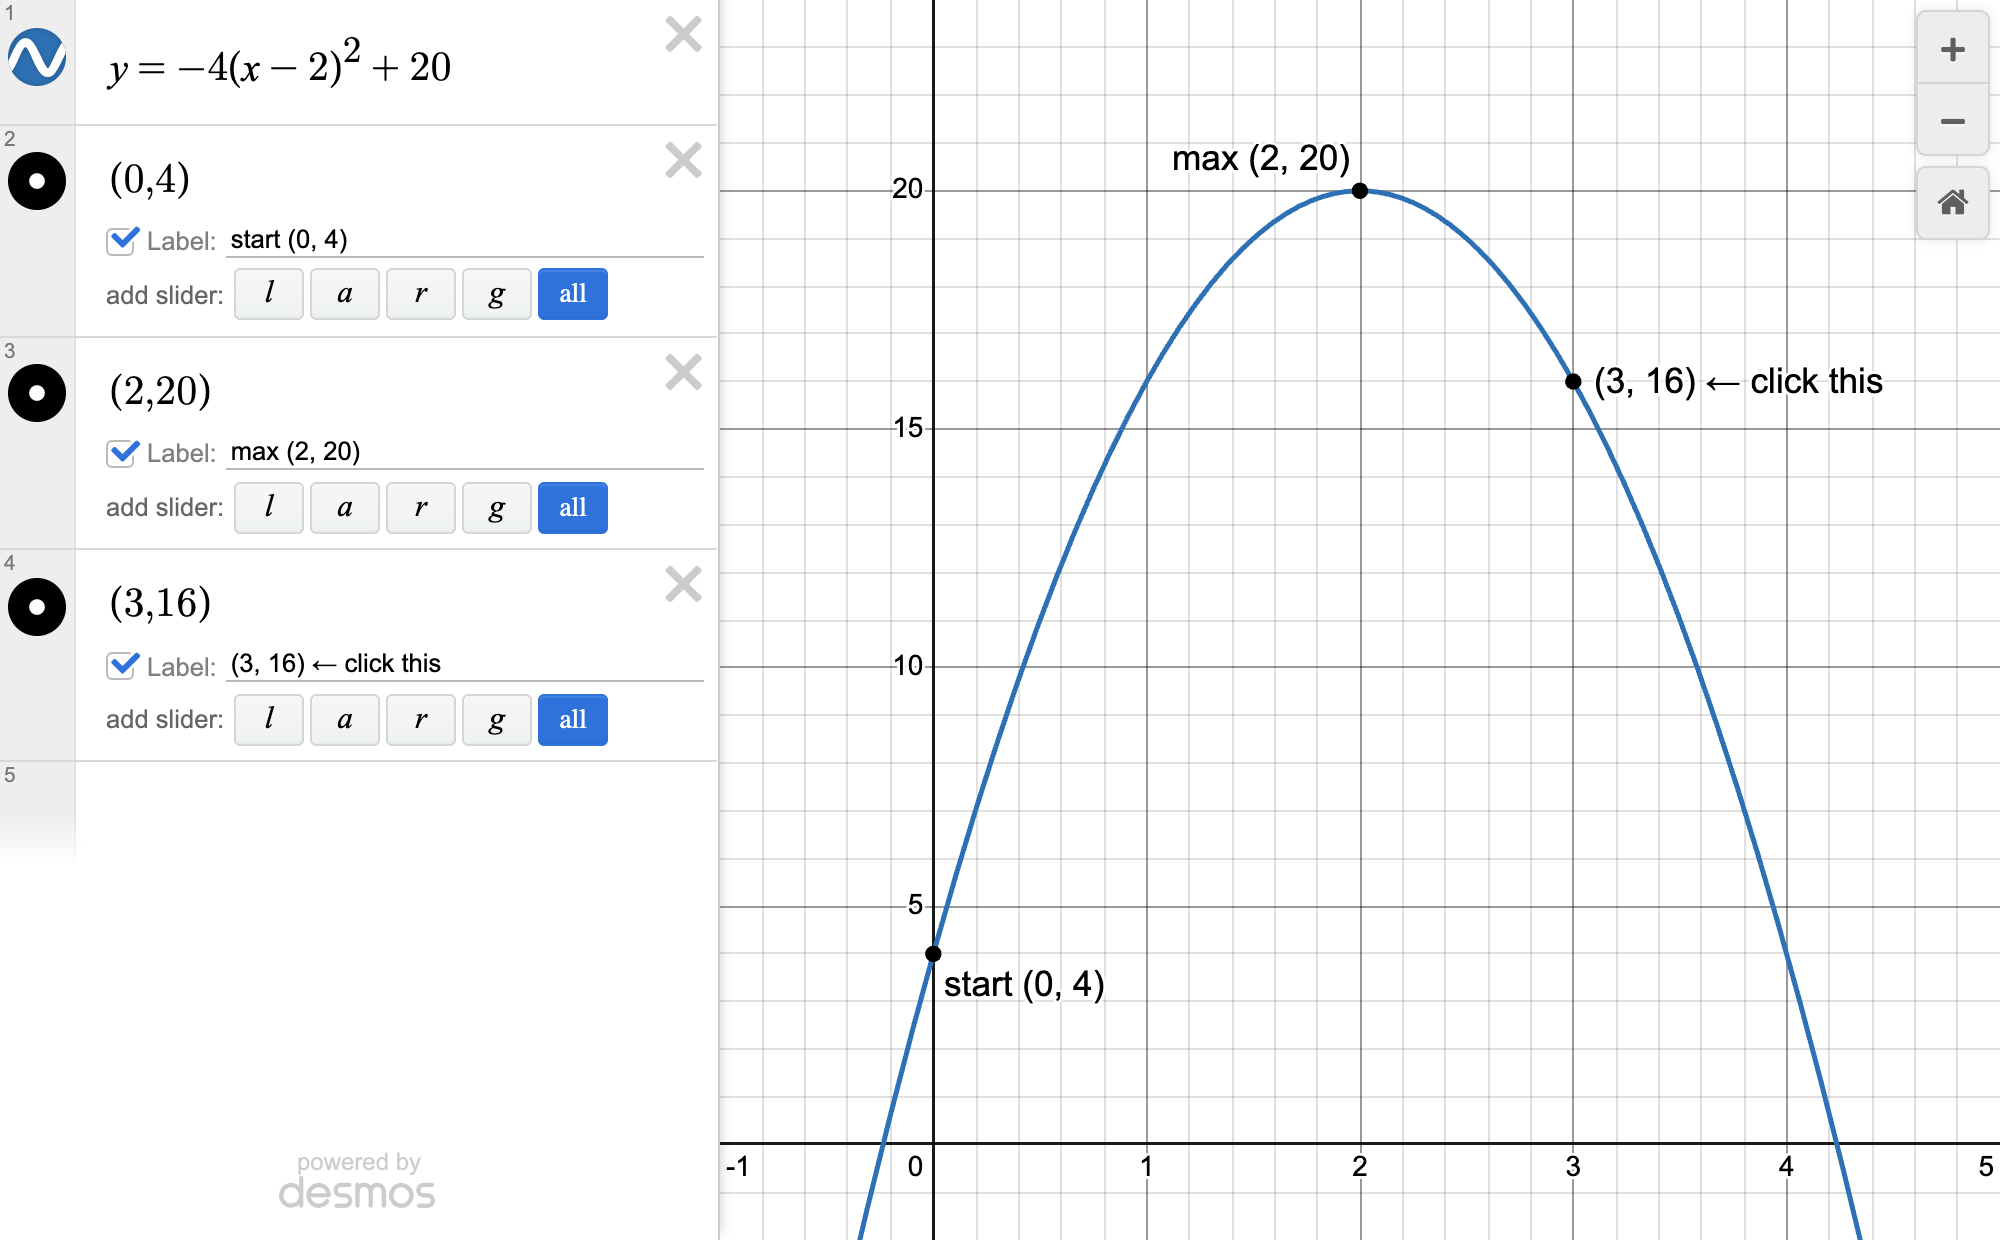
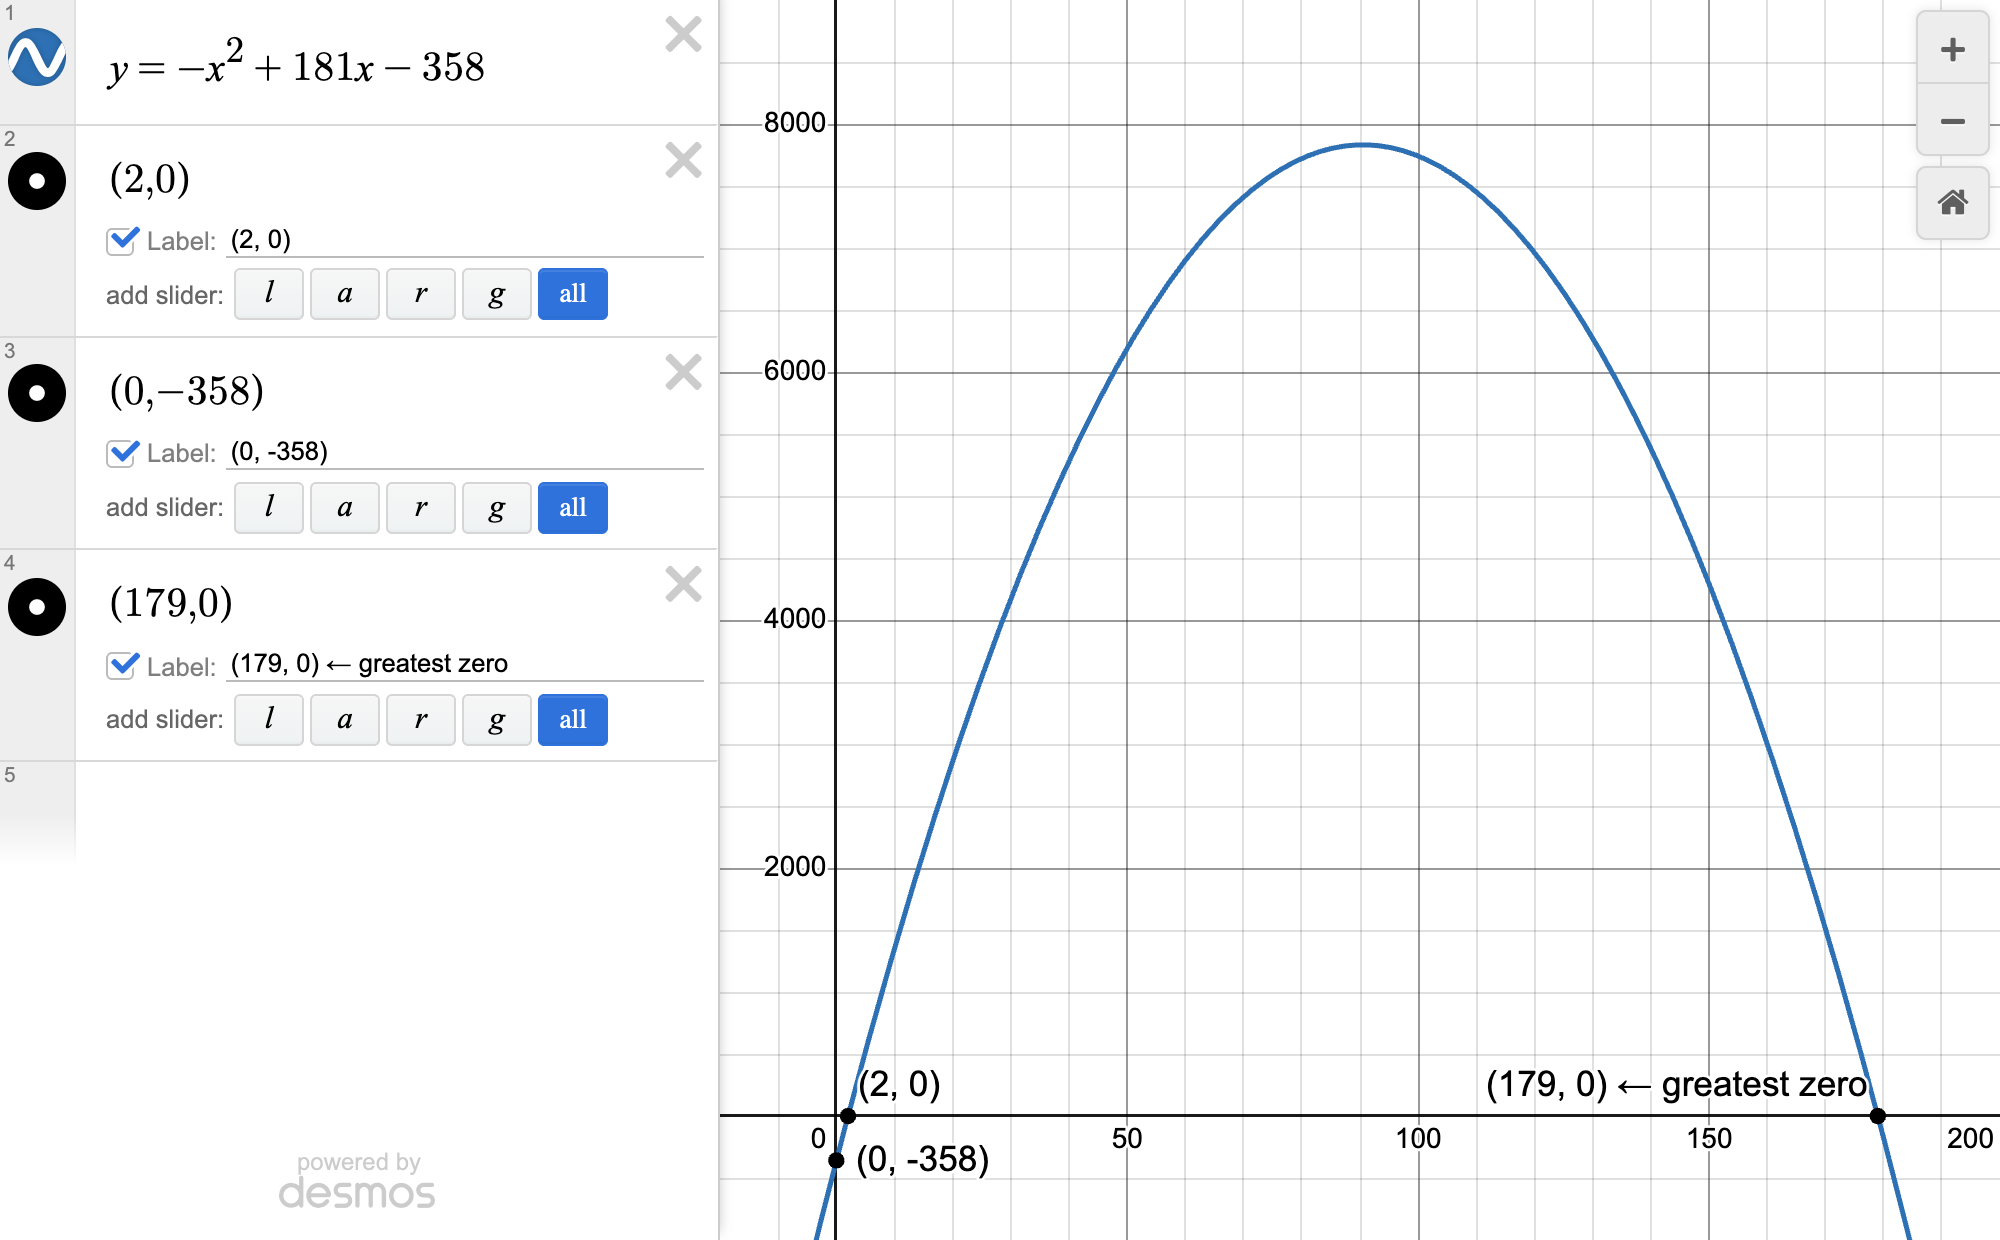
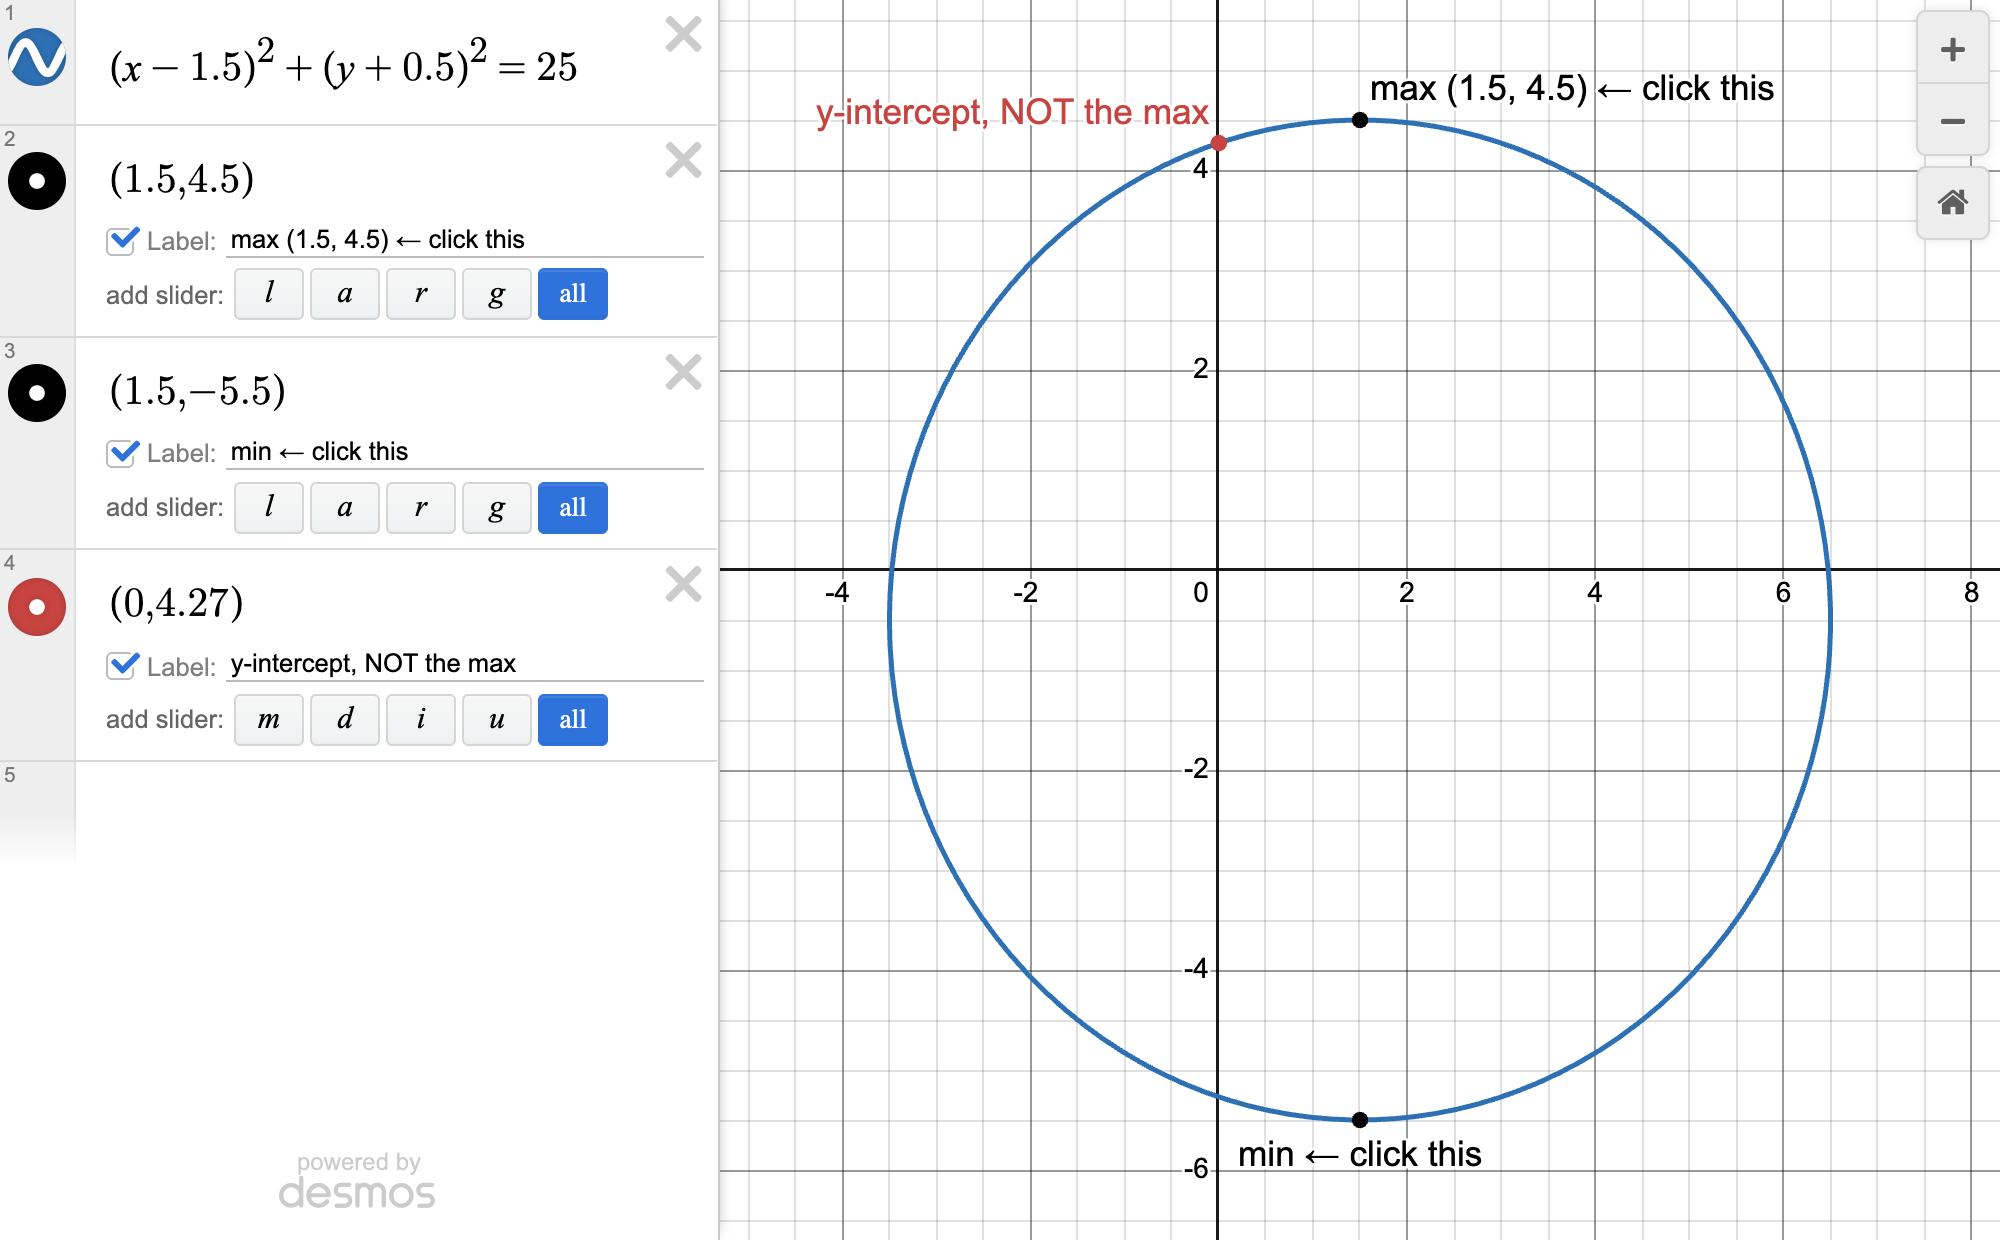
| Question asks for an intercept, max/min (vertex), or intersection | Click gray points on graphs |
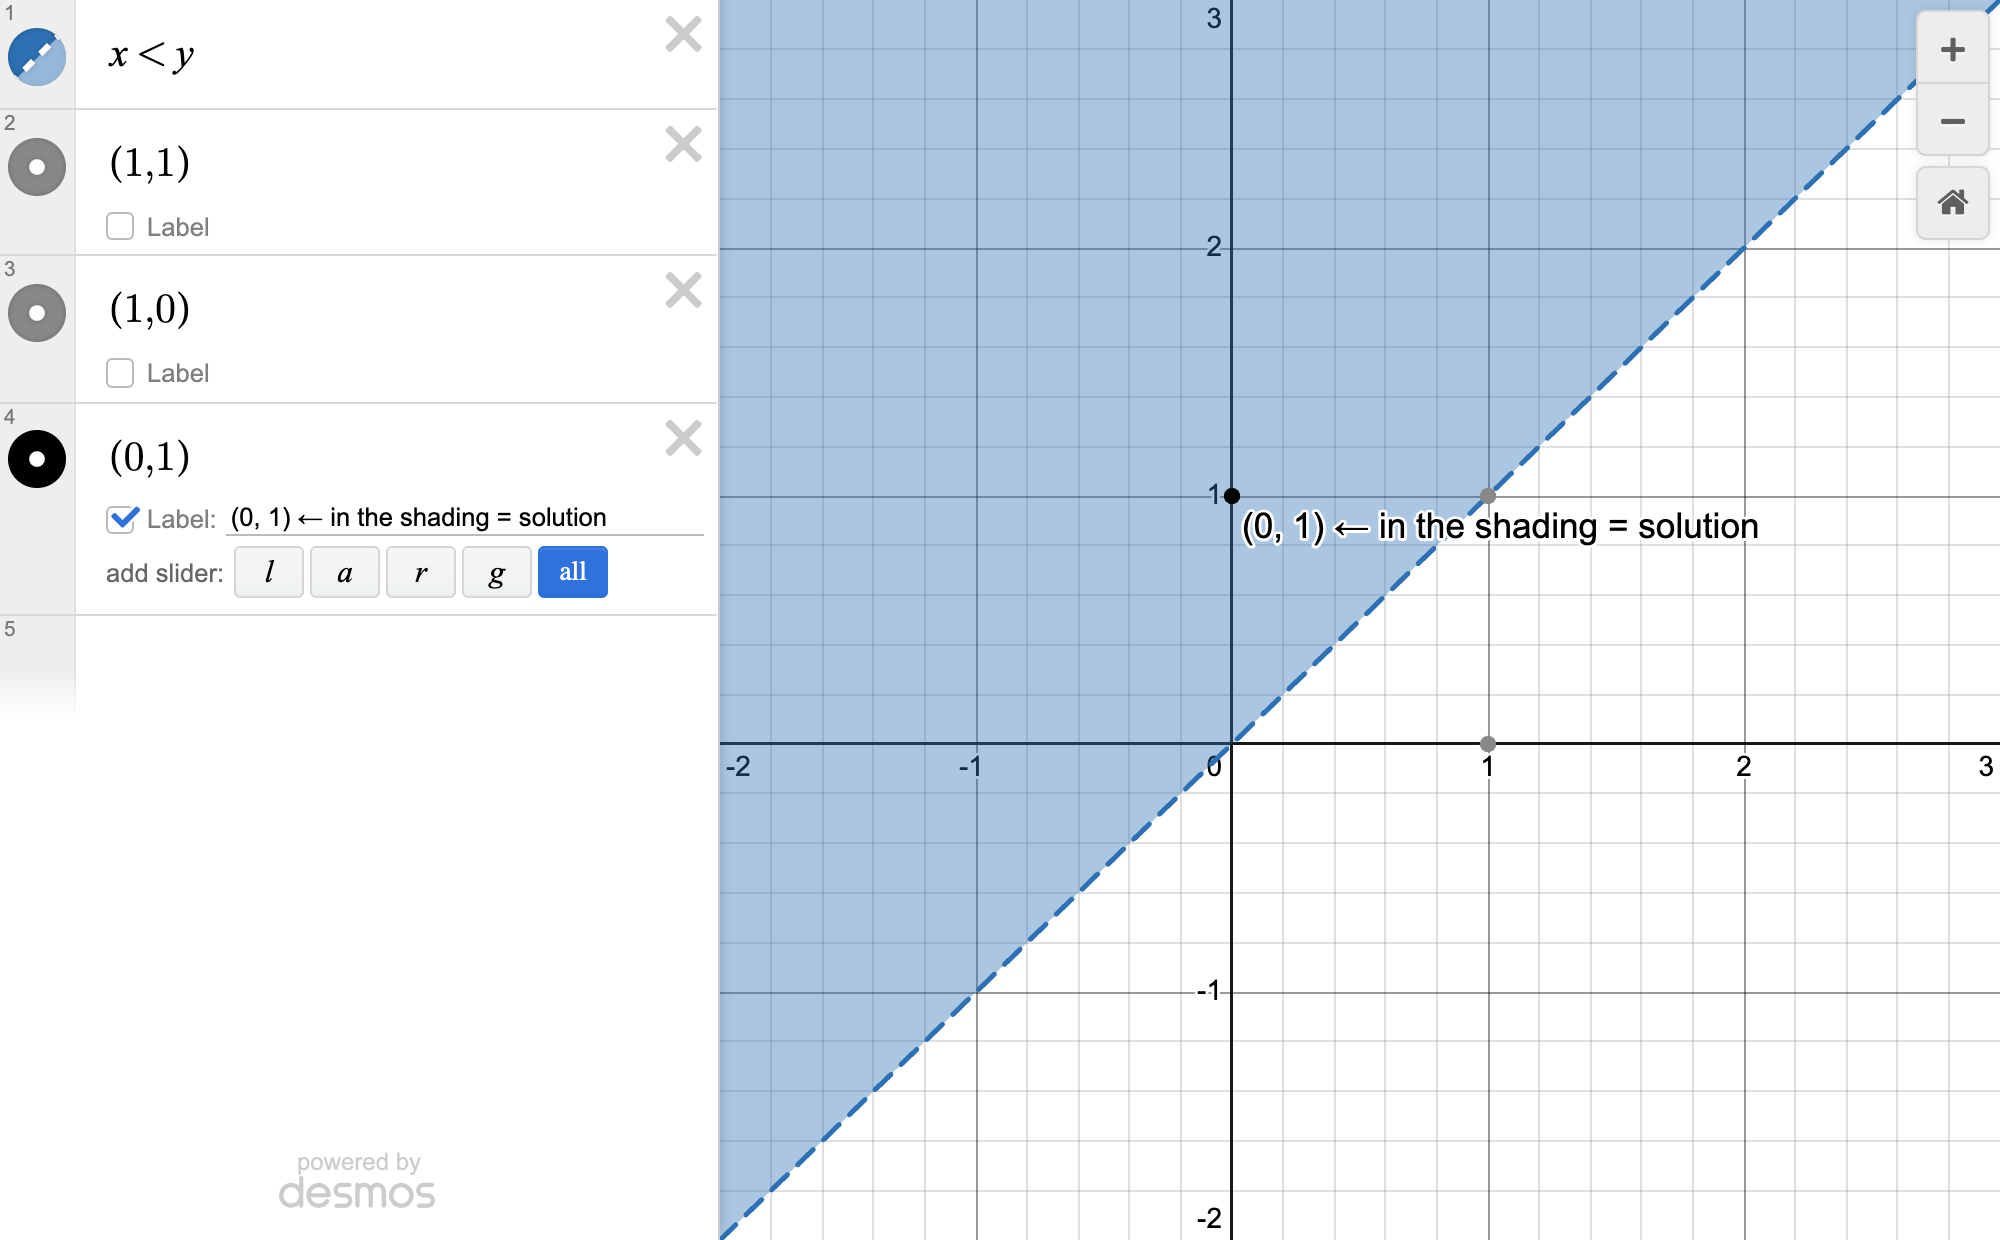
| Question asks which point is a solution to an inequality or system | Inequalities: dashed vs solid |
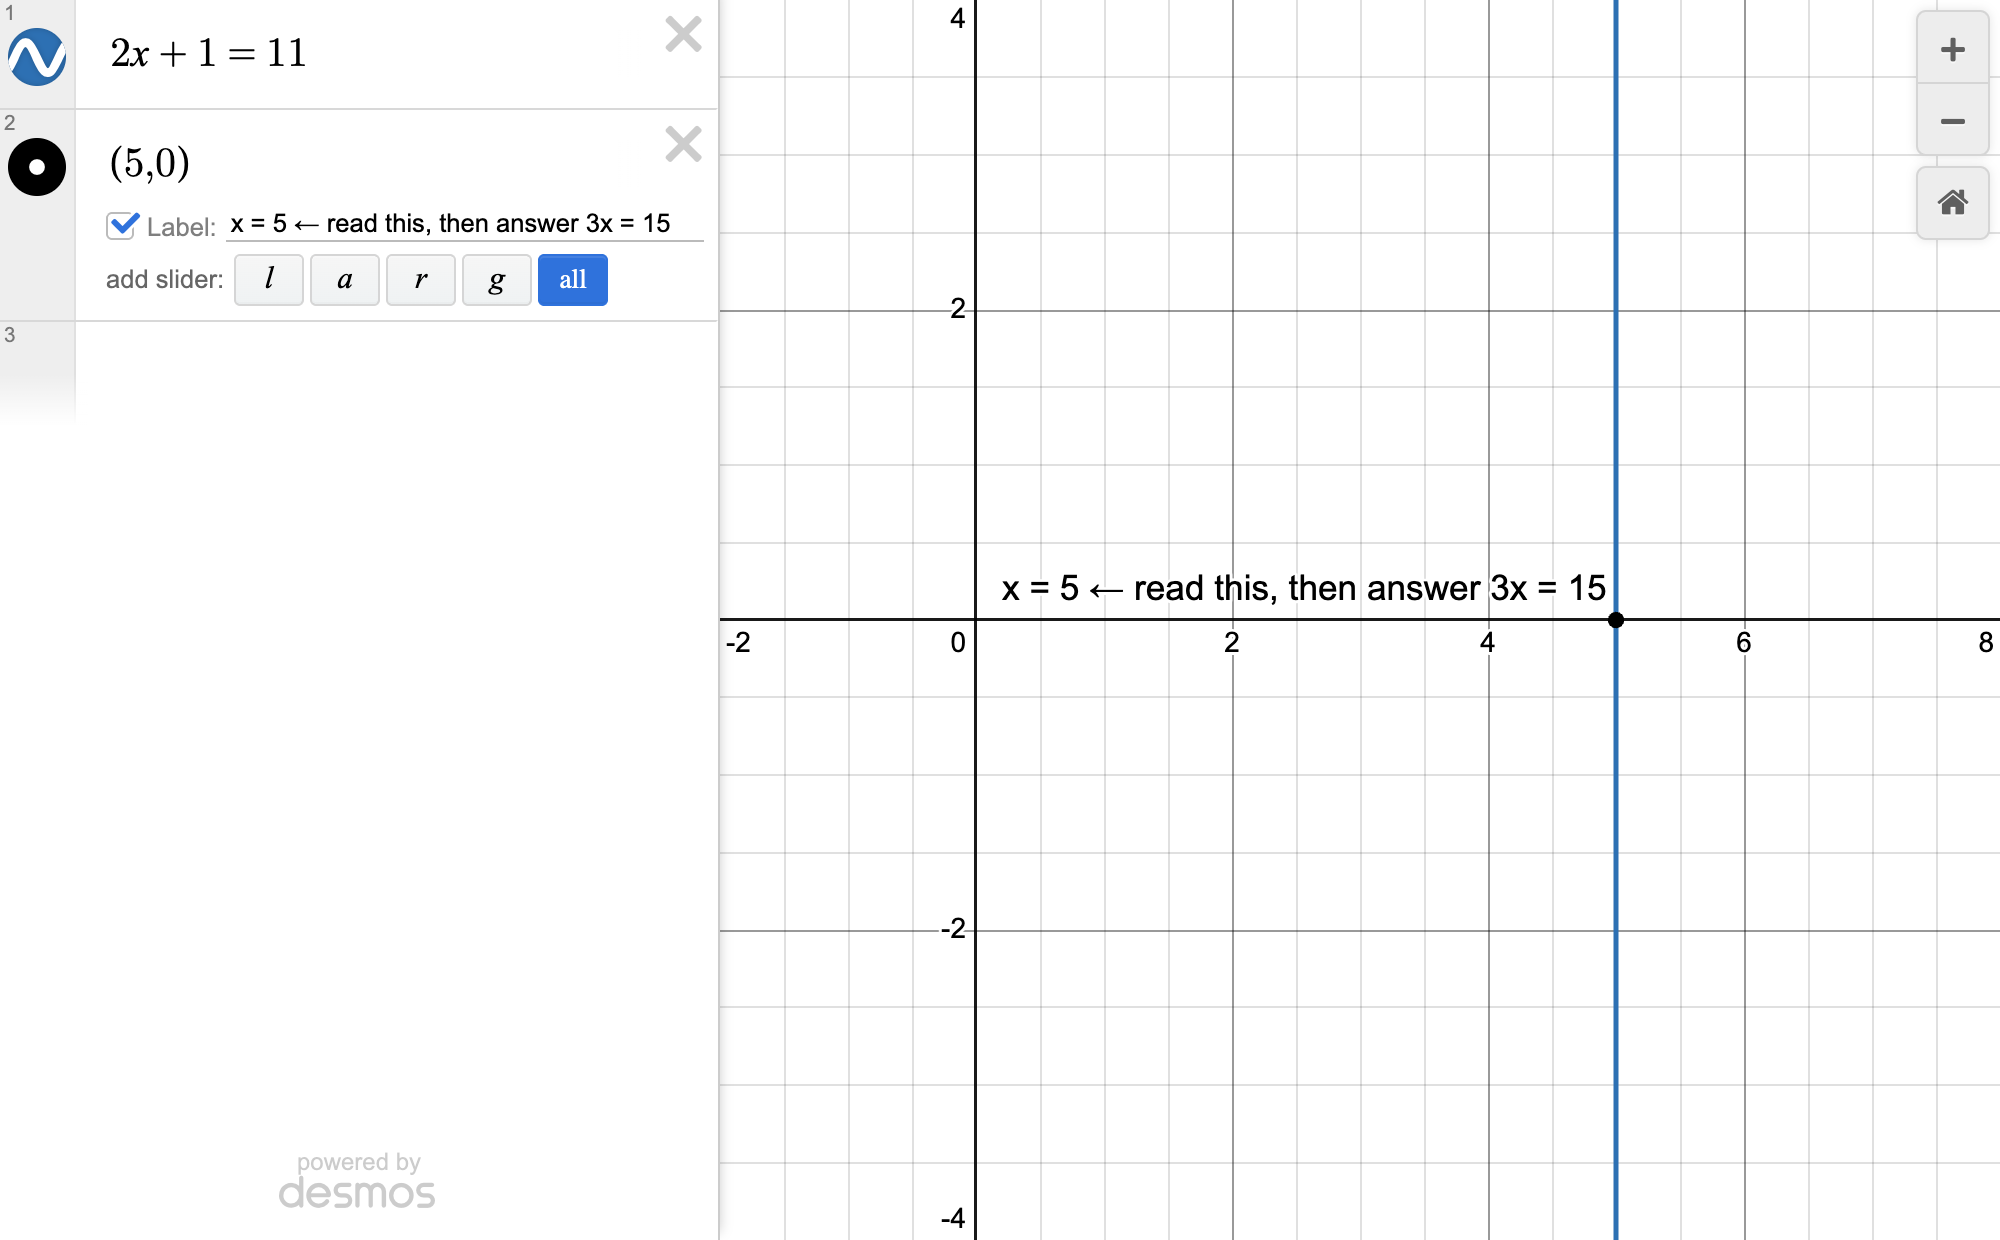
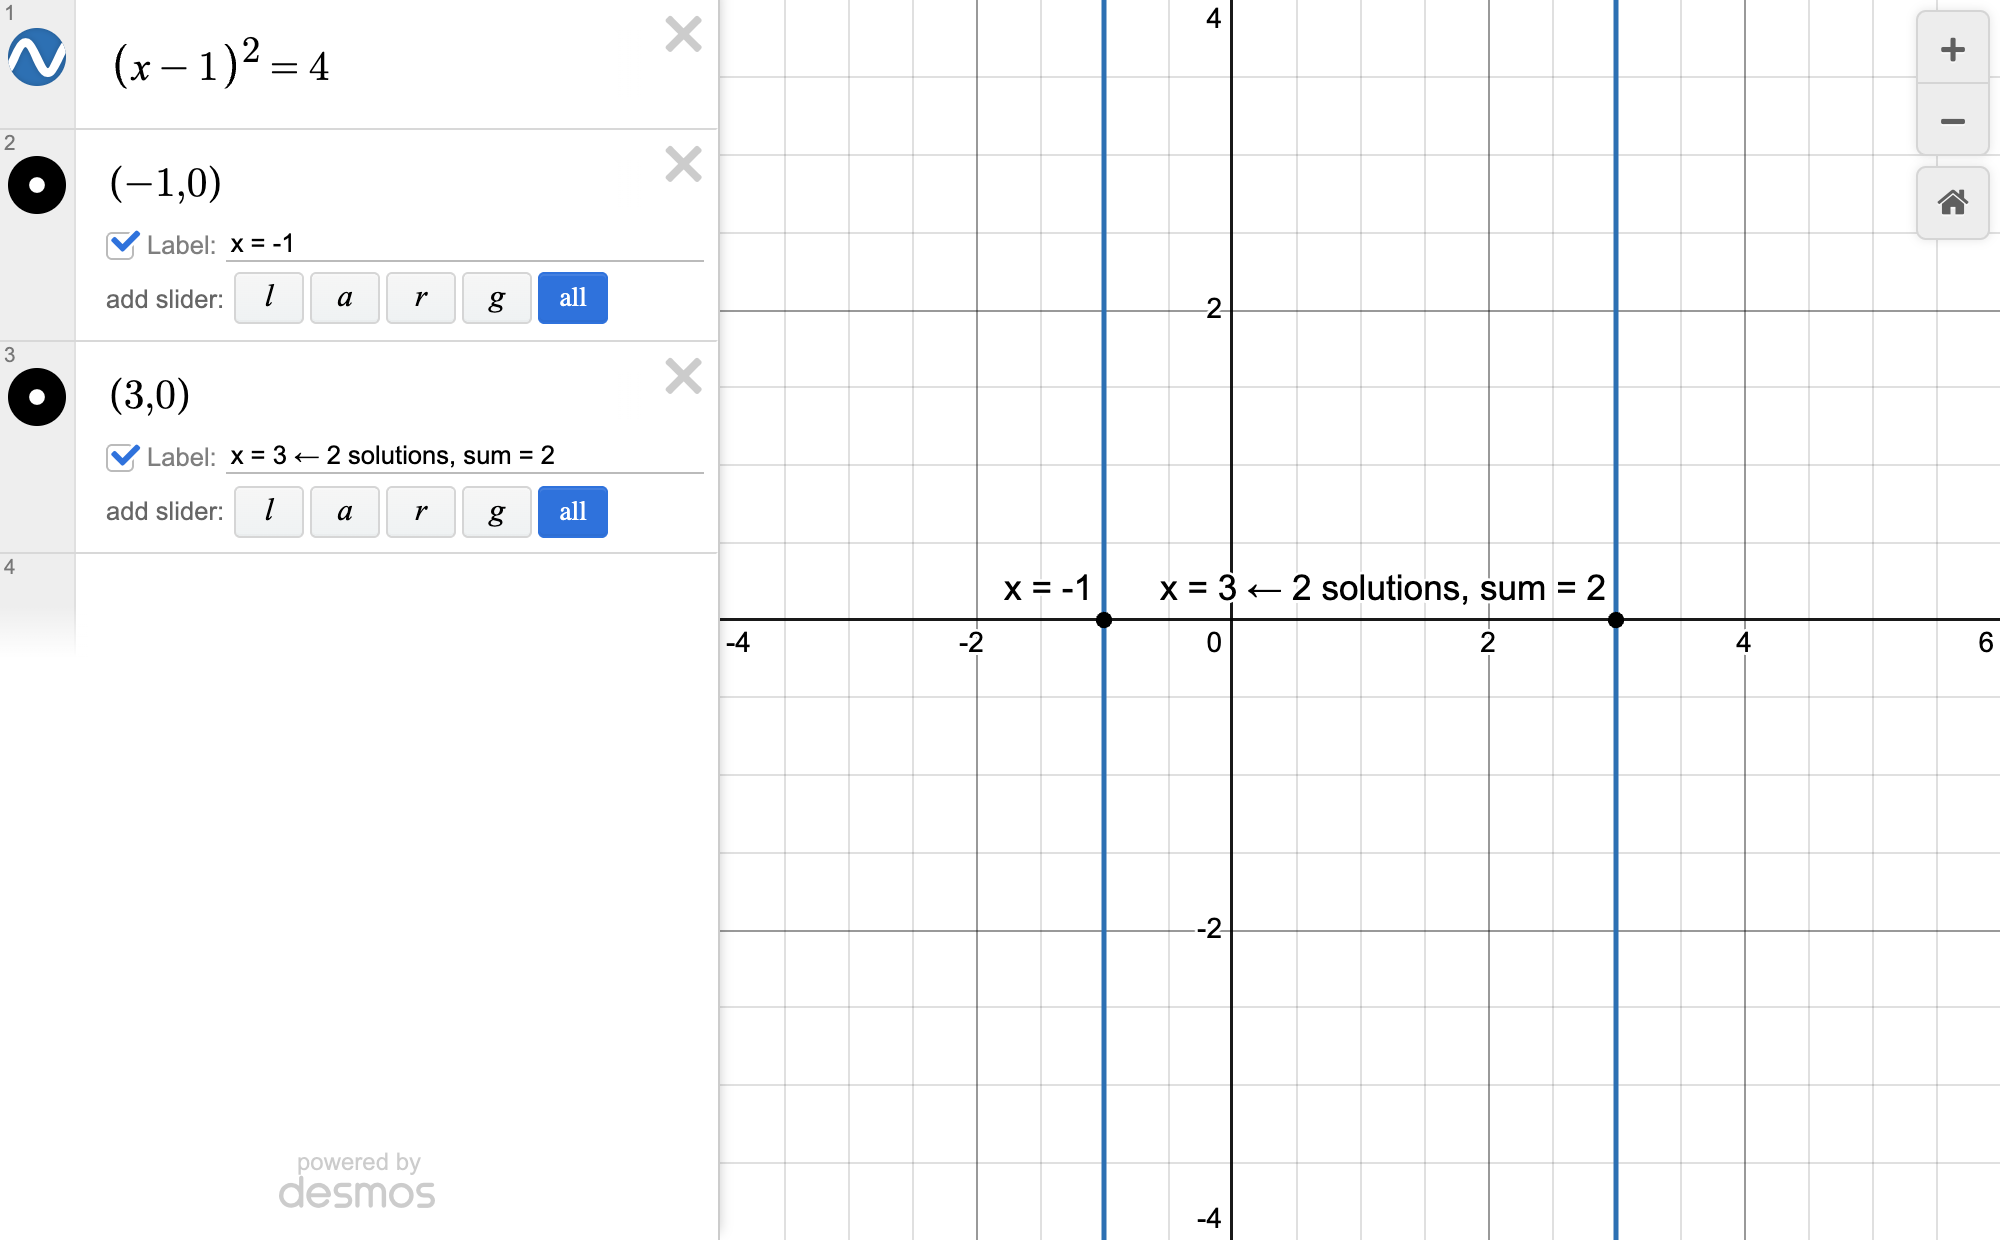
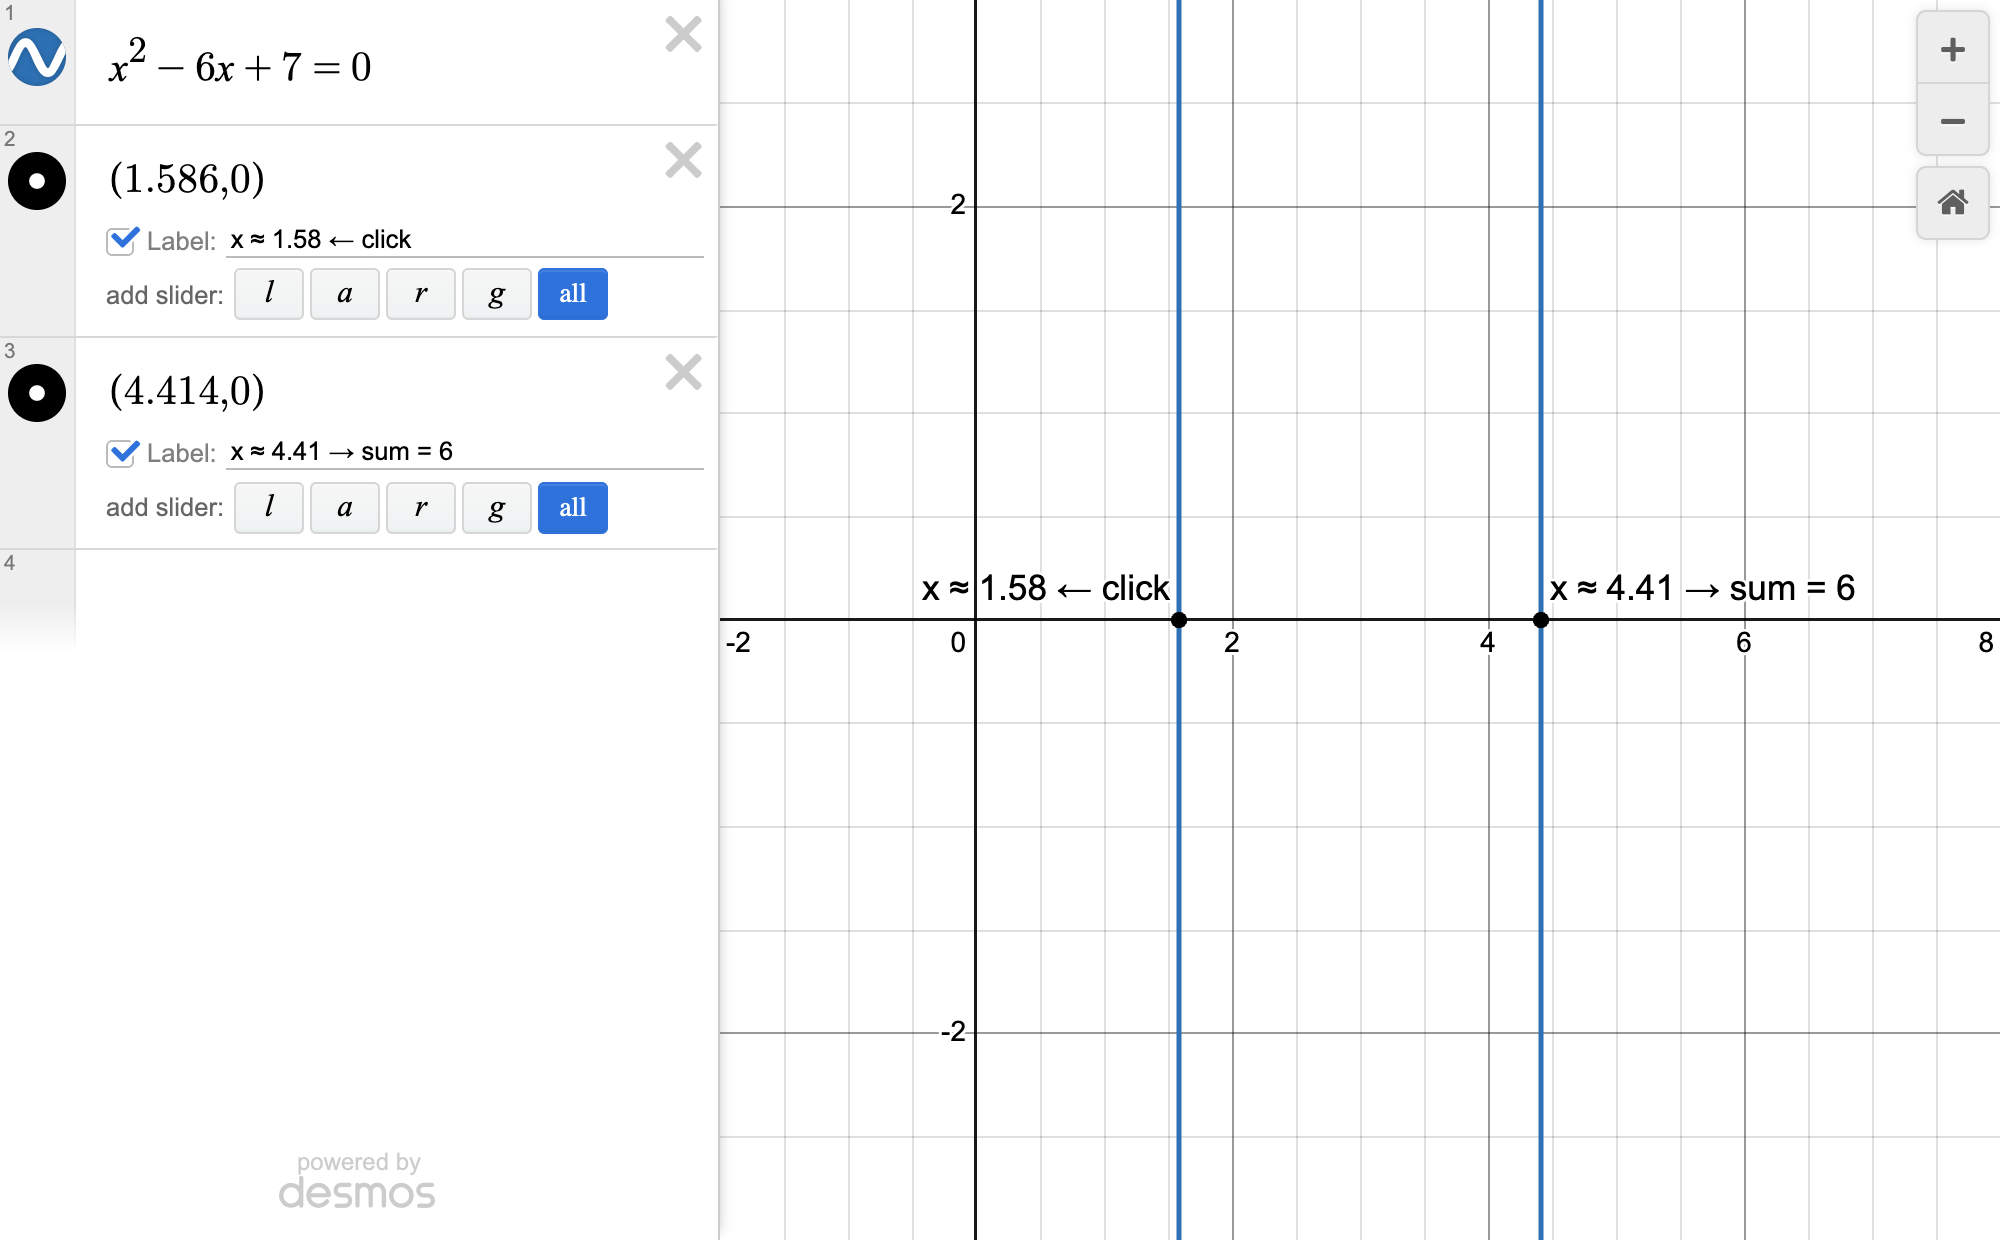
| Equation has only x (no y); asks for x or an expression in x | One-variable equation = vertical lines |
| The unknown is a letter other than x (like a, t, n) and you want to graph it | Rename unknown to lowercase x |
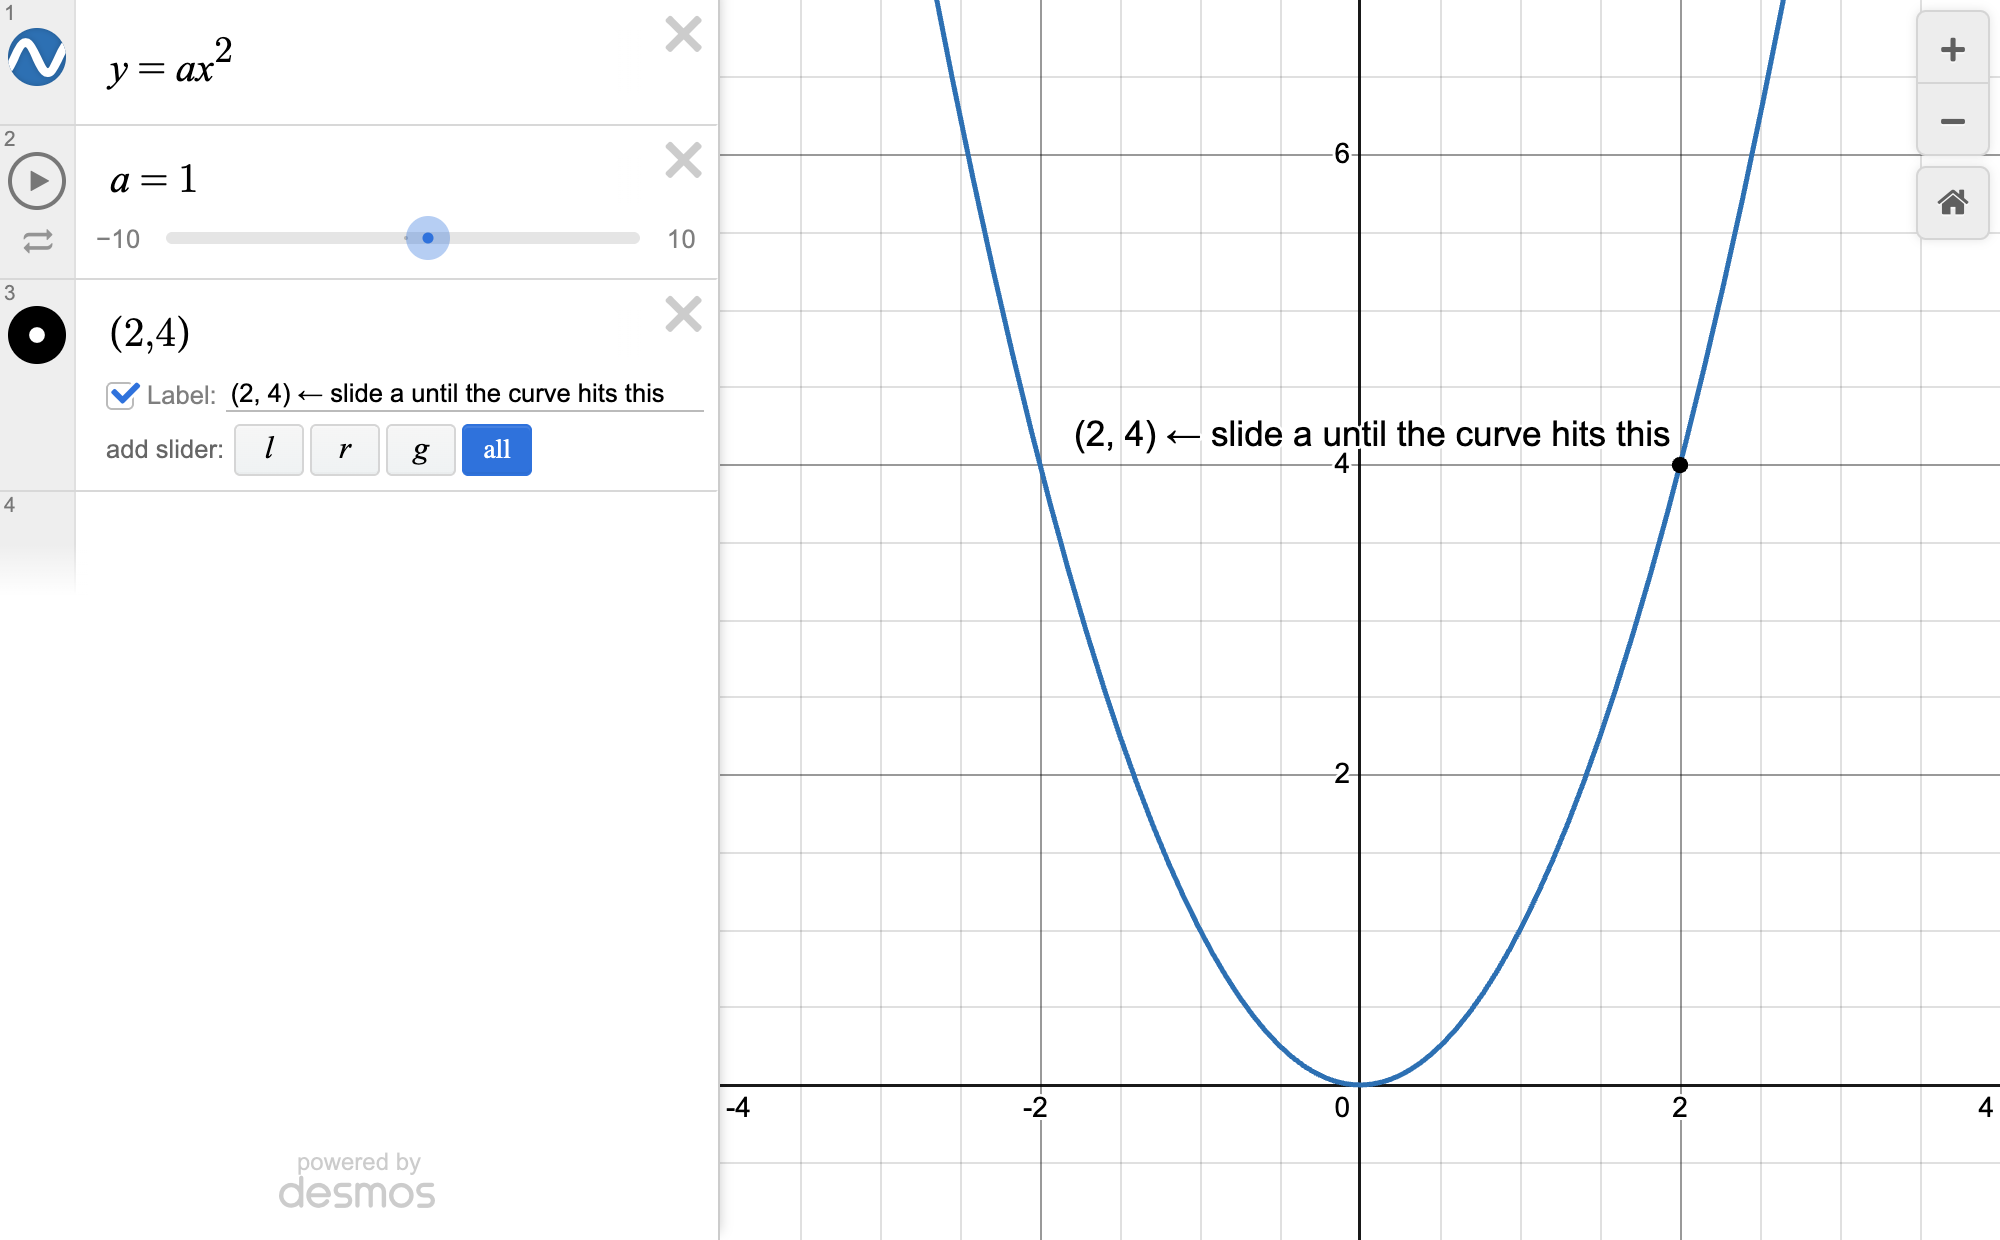
| Question asks what value of a constant makes a graph pass through a point (or similar) | Sliders for unknown constants |
| Question uses f(x), g(x), f(2), f(x+2), or combos of functions | Function notation does it all |
| You have several points to plot, or a point is way off-screen | Tables for points + Zoom Fit |
| Question gives points and asks for the line/curve through them | Add regression from a table |
| You need to reuse a line (no copy-paste) or check if one graph hides another | Edit list: duplicate, color, toggle |
| Question asks the y-value (output) at a specific x | Create table: y for any x |
| Question gives an equation and asks for an equivalent form (e.g. standard vs vertex/factored) | Convert equation to another form |
| Question needs the whole-number factors of a number | Find factors with number/x |
| Answer choices are fractions but Desmos shows a decimal | Decimal to fraction button |
| Question asks mean, median, standard deviation, distance, midpoint, percent, or greatest common factor | Built-in stats/geometry functions |
| Rarely needed; there's usually an easier way | Honorable mentions (optional) |
| Any time you enter roots, pi, fractions, or exponents | Type, don't use the keypad |
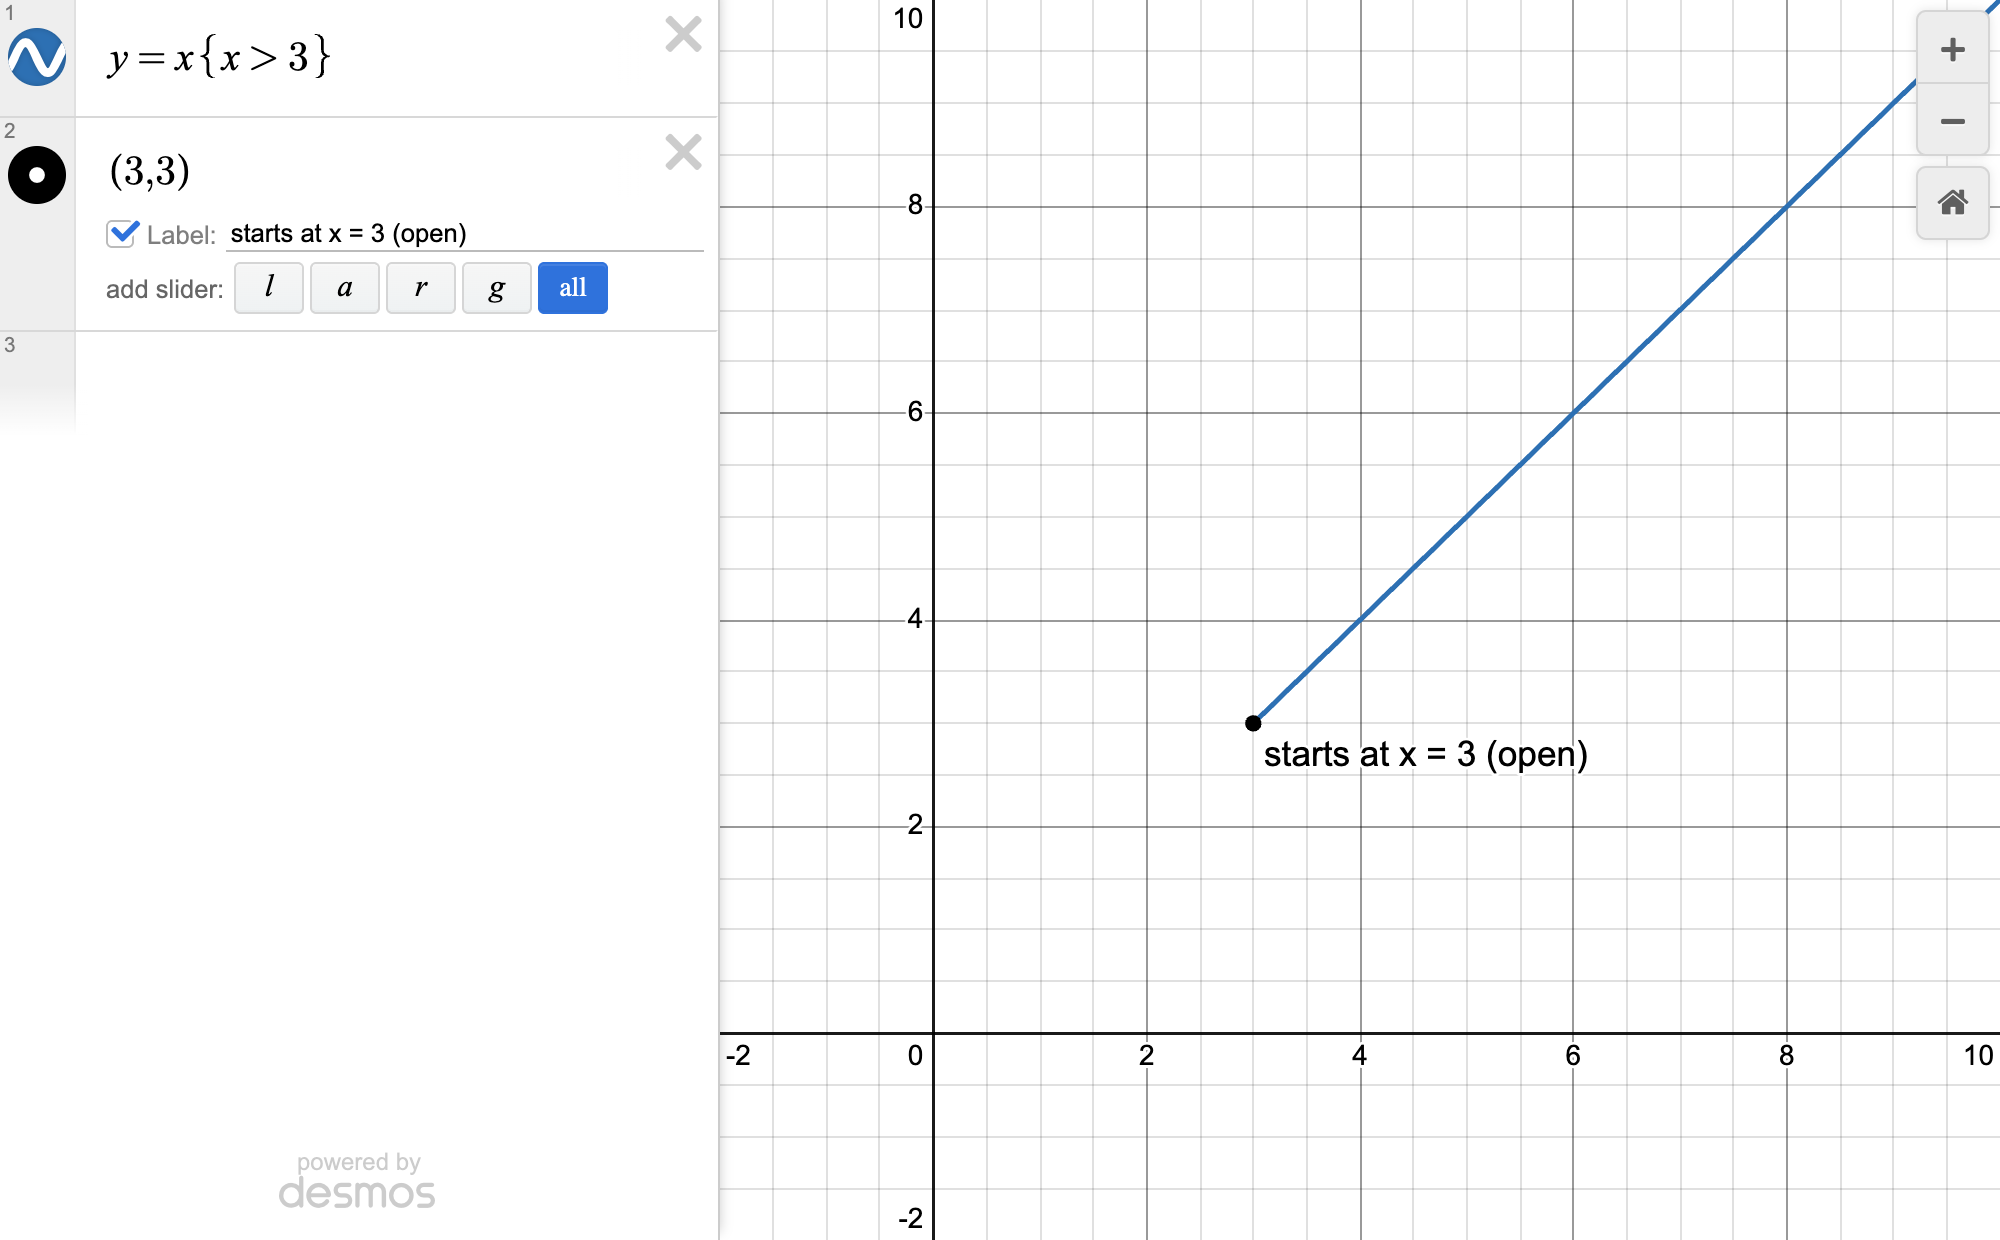
| You need a graph only on part of its domain, or only positive/negative solutions | Curly brackets set constraints |
| You'll use the same data set more than once (mean and median of same list) | Square brackets make lists |
| Any trig question with angles in degrees | Switch to DEGREES for trig |
| You have an equation (something = something) and need x or an expression with x | Regression solves any equation |
| Question asks how many solutions, sum of solutions, or greatest/least possible value | Multiple solutions: graph instead |
| Question says expressions are equivalent / true for all x and asks for a constant (a, b, k) | Solve for constants: x1=[1...10] |
| "A solution to the equation is x = ___" plus unknown constants | Given solution: set x_1 to it |
| "k is a positive constant", "p > 1", any condition the answer must meet | Force conditions with curly braces |
| Two or more equations share unknowns (system of equations, chained percent statements) | Systems: bracket list regression |
| Hard percent word problems: "A is __% of B, B is __% of C... what is Q?" | Percent chains: "is" means = |
| Any bracket (multi-equation) regression, especially when starting out | Check with L and R lists |
| Several equations and "N is a constant" (so the other letters are variables) | Multi-equation: vary one variable by hand |
| Desmos returns a long messy decimal for the answer | Ugly decimal = probably wrong |
| After setting one variable to a number, you're tempted to set the others too | Don't over-define the variables |
| Hardest type: constant changes when you change x, even with bracket regression | Constant changes? Make one equation |
| Graph with points, listed points, or function notation like f(2)=8 | Points anywhere means use a table |
| One of the points holds the thing you're solving for (e.g. (k, 0)) | Never graph the unknown point |
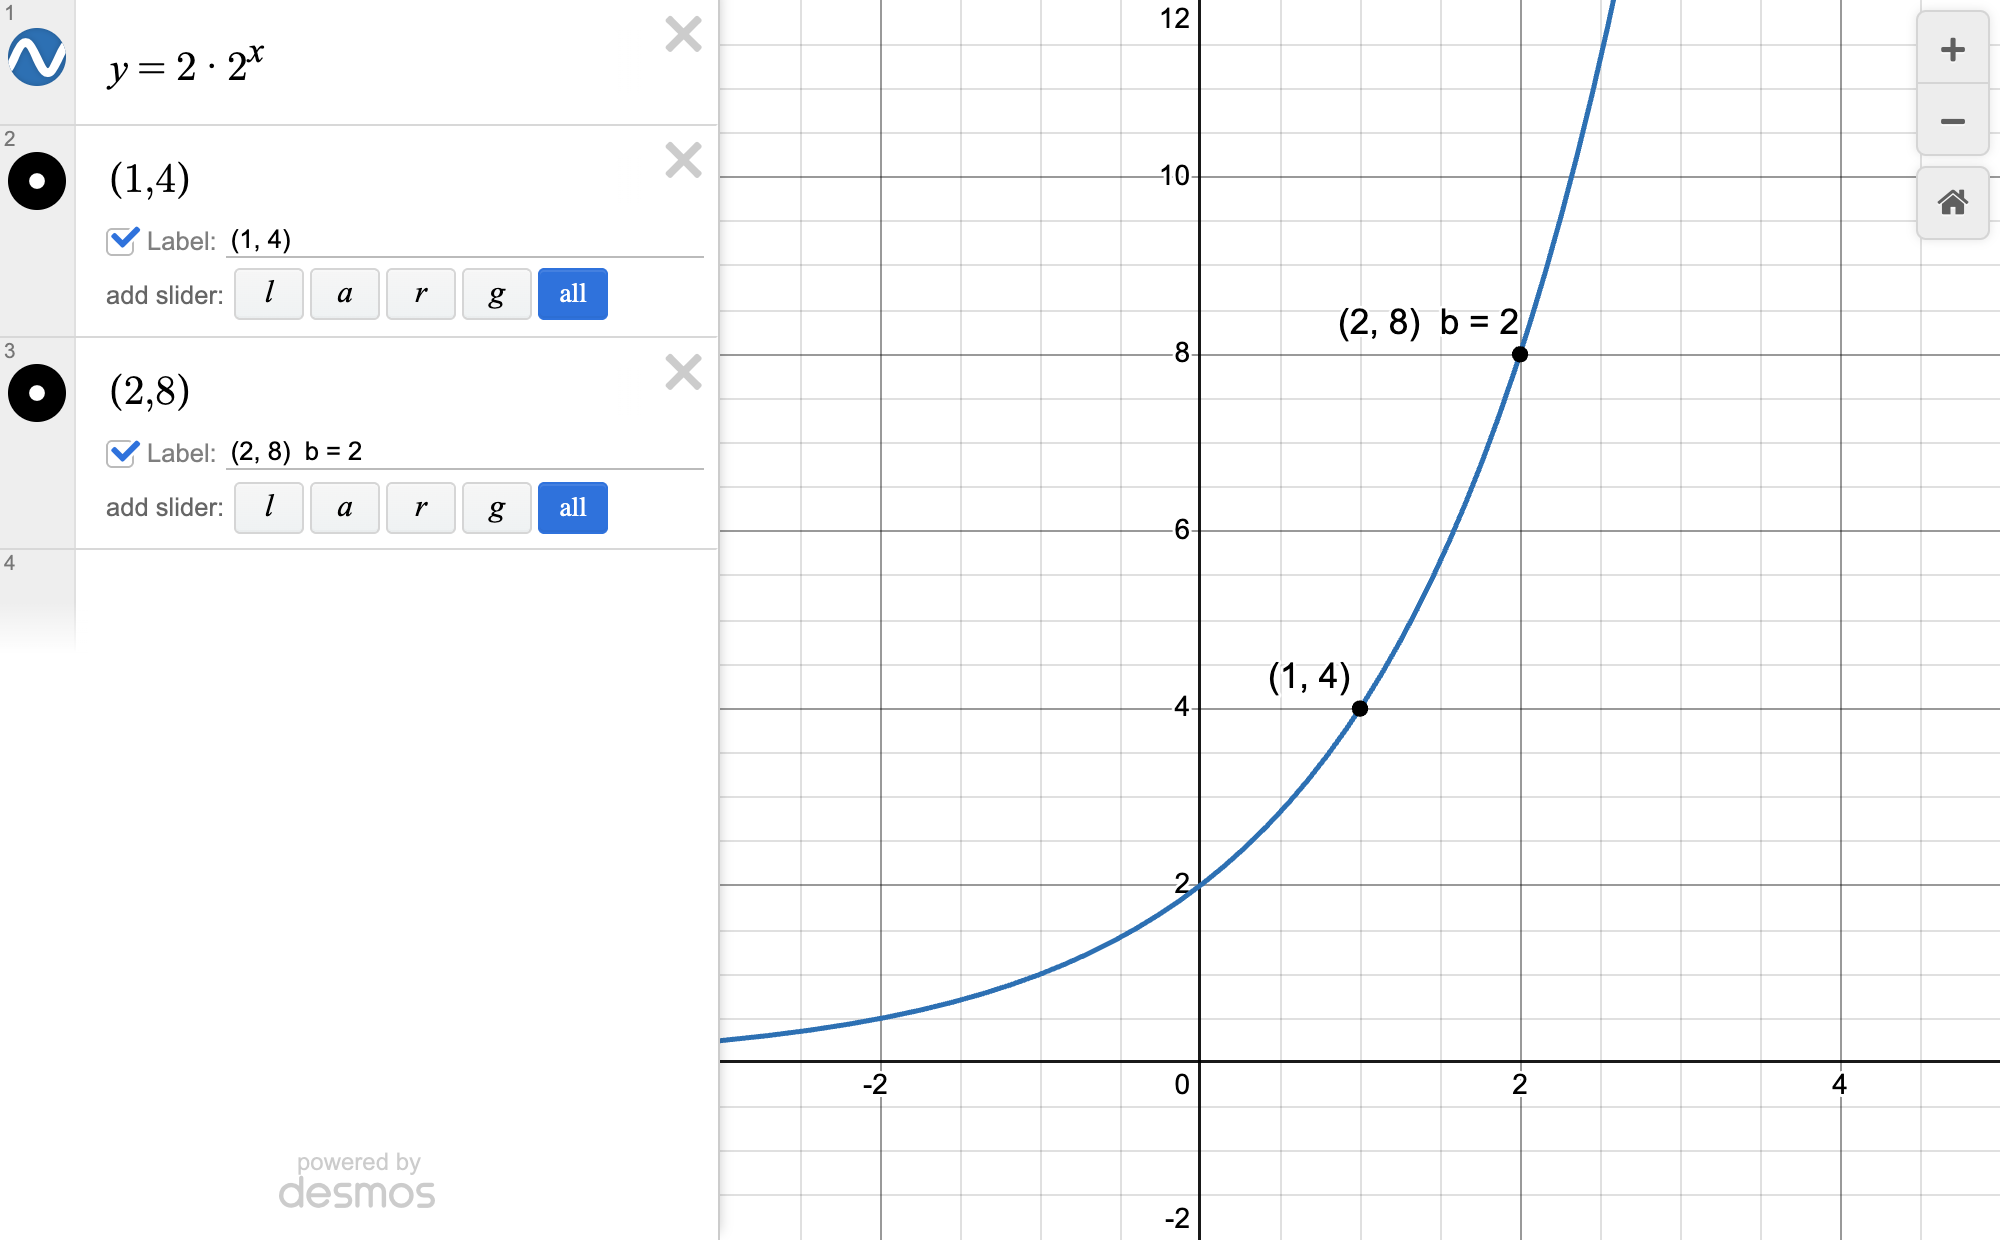
| The equation's form matches a preset (a·b^x, linear, standard quadratic) | Dropdown regression when form matches |
| Question gives points AND the equation that goes through them | Custom regression in 3 steps |
| Points given but NO equation: "passes through a circle" or "maximum/minimum" | Memorize circle and vertex form |
| "A circle passes through these points... find k" where one point is unknown | Circle through points |
| Word problem says "maximum height" / "minimum" and it's a quadratic | Vertex form for max/min |
| Picking points off a graph for a regression, or regression gives a wrong curve | Points needed = constants to find |
| Answer choices look like ax + by = c (line in standard form) | Standard-form line: fix one constant |
| Question says the equation contains the points, but the regression misses them | Bad fit? Add +0.0001 |
| Regression ignores your table, or you added a second table | Table = x_1, y_1 lists |
| Regression won't give a value for the letter you want | Defined constants won't be solved |
| You're using ~ regression to solve for a constant that already has a value elsewhere in Desmos | Regression letters must be undefined |
| "Which equation correctly expresses R in terms of P, Q, and F?" (get one letter by itself) | Isolation: plug-in numbers check |
| An expression equals an expression, OR the question gives points (or a graph you can read points from) | When regression works |
| Two equations in x and y; asks for x, y, or something like x − y | System of equations: graph it |
| "Sum of the solutions", "greatest solution", "least possible solution" | Sum/greatest of solutions: graph |
| "How many solutions" / "exactly one solution" / answer choices like 0, 1, 2, infinitely many | Count solutions = count crossings |
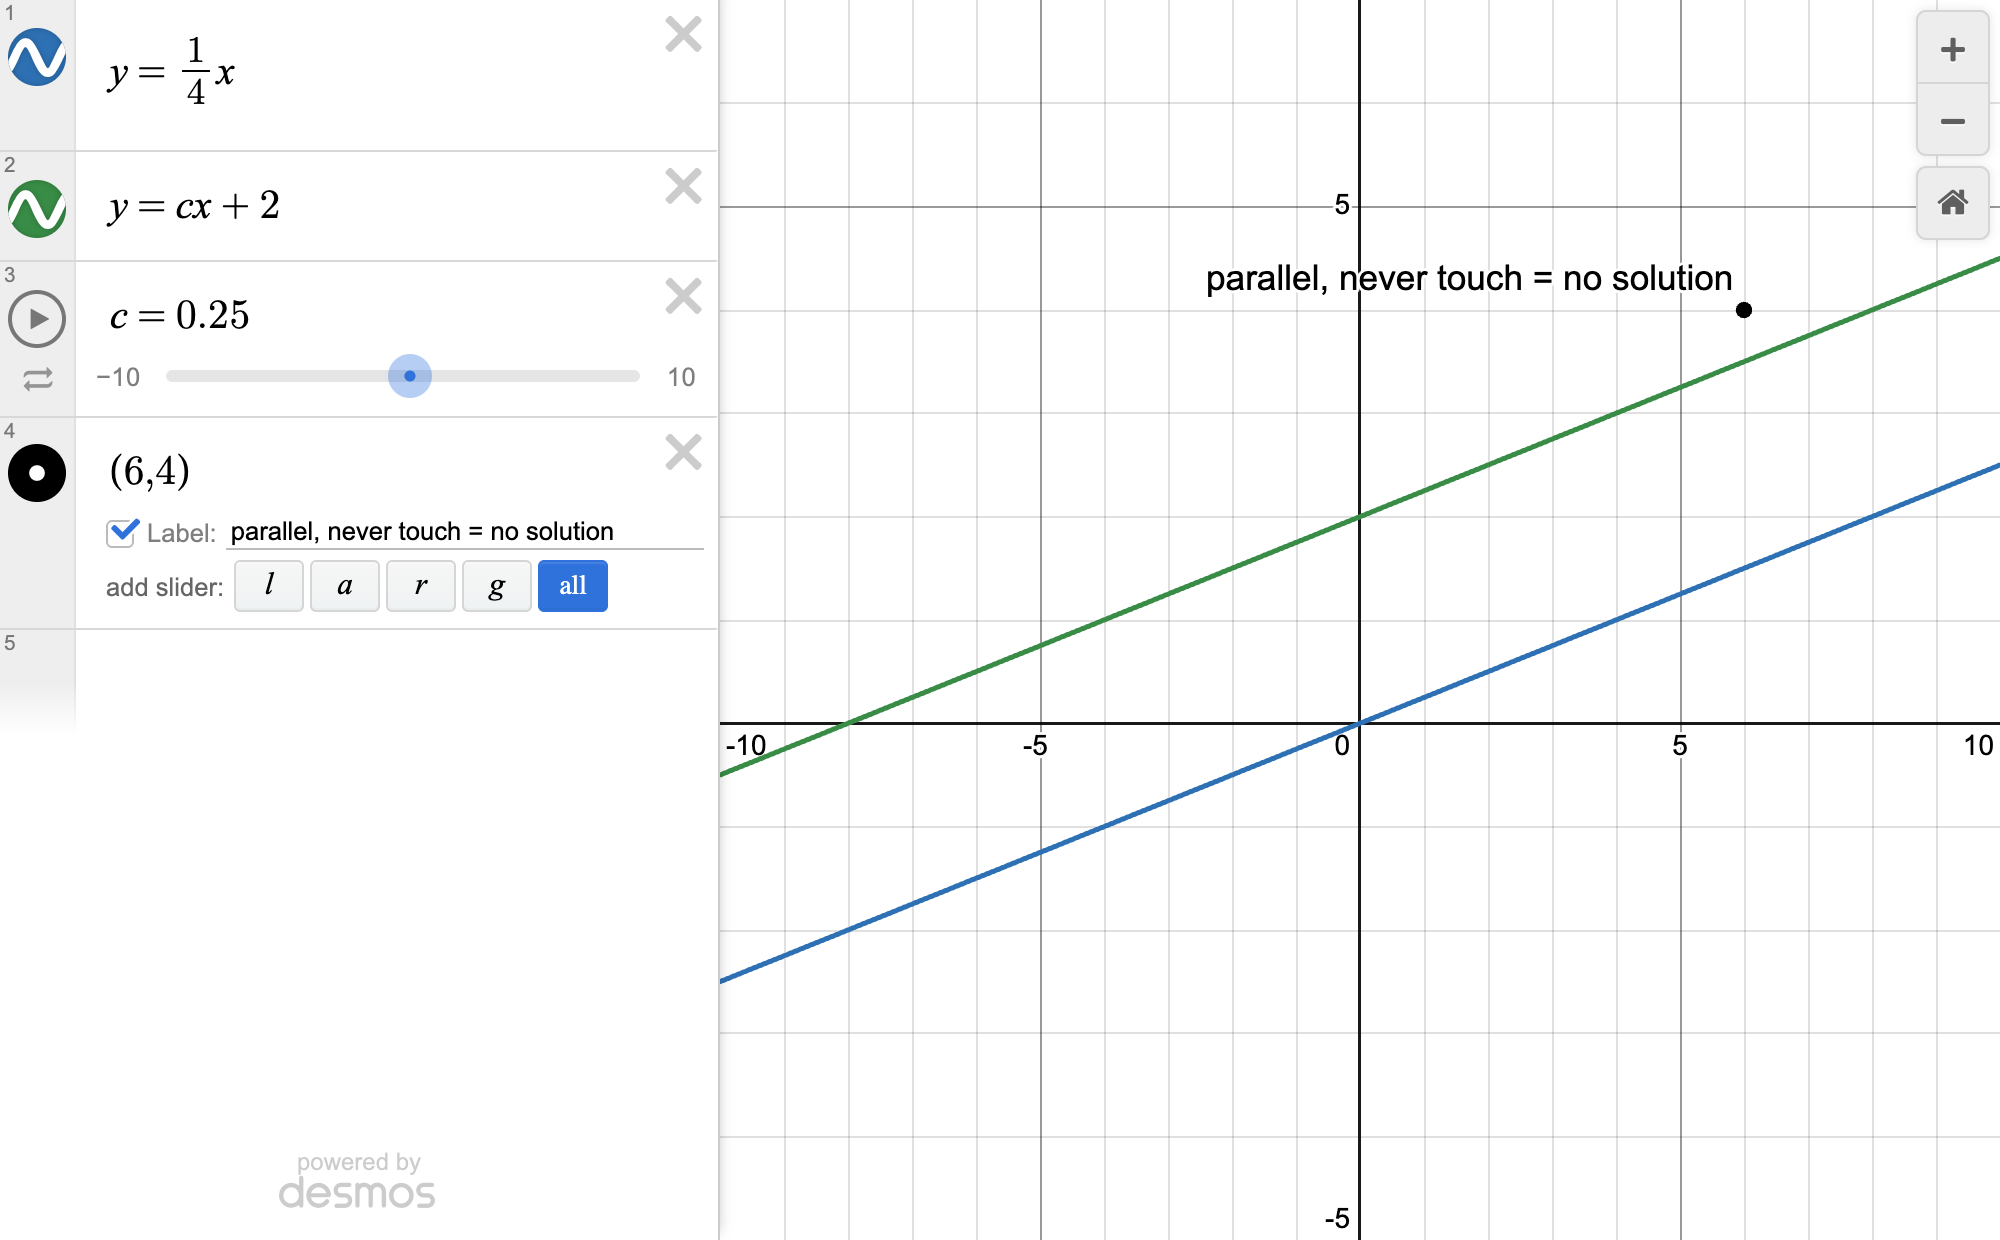
| "For what value of k does the system/equation have no solution?" | No solutions: lines never touch |
| ANY question about the NUMBER of solutions (none, one, infinite, how many) | Always split into two lines |
| The question SAYS the equation has infinitely many solutions and asks for a constant | Infinite solutions: use regression |
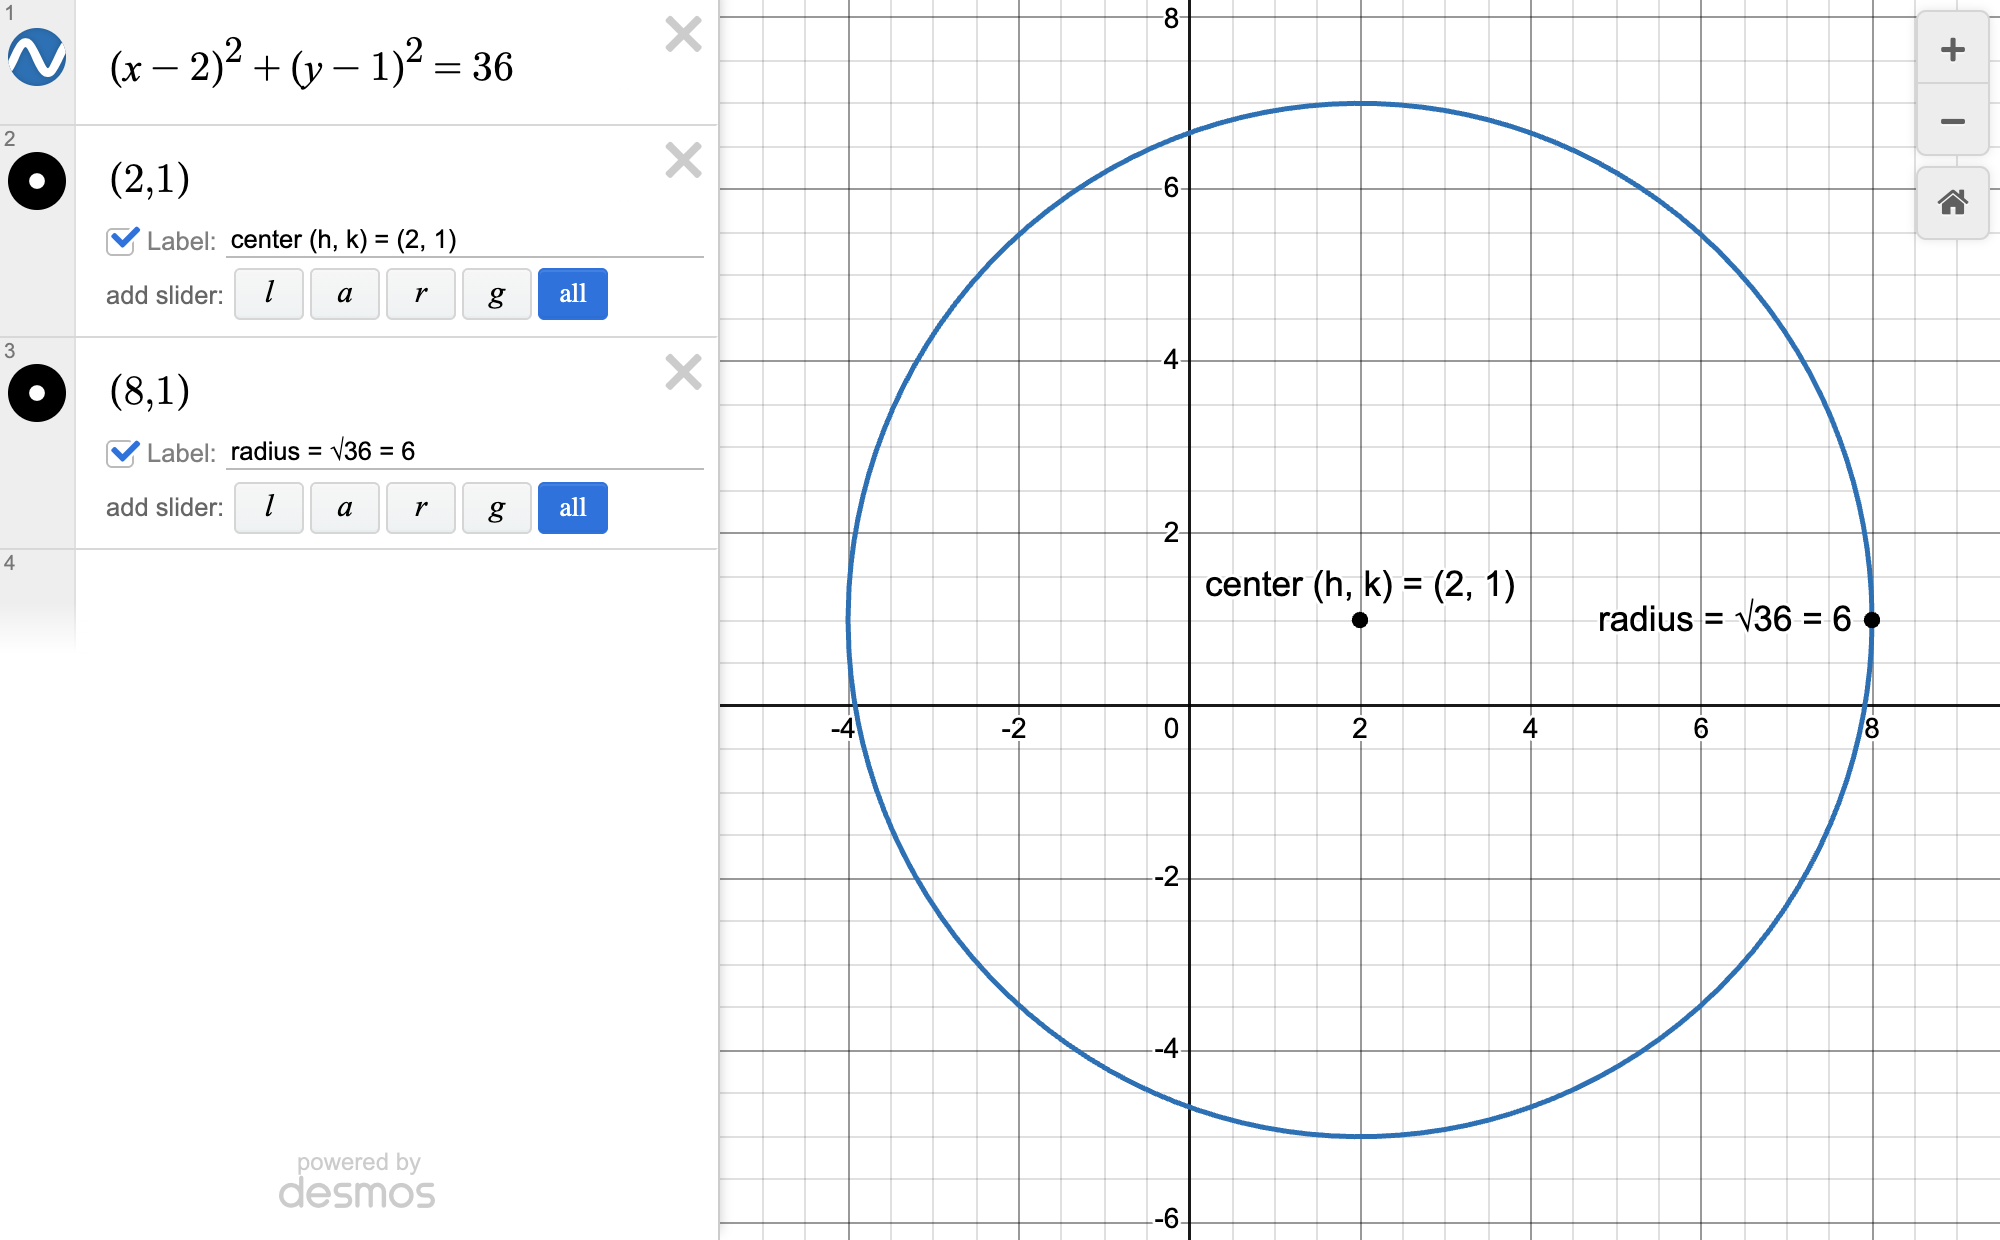
| Given a circle equation, asks for the radius (or diameter) | Circle radius: max to min |
| Asks for the center, or which point is inside the circle | Circle center + inside points |
| "Which expression is equivalent to..." (any expression, pick the matching choice) | Equivalent expressions: overlap test |
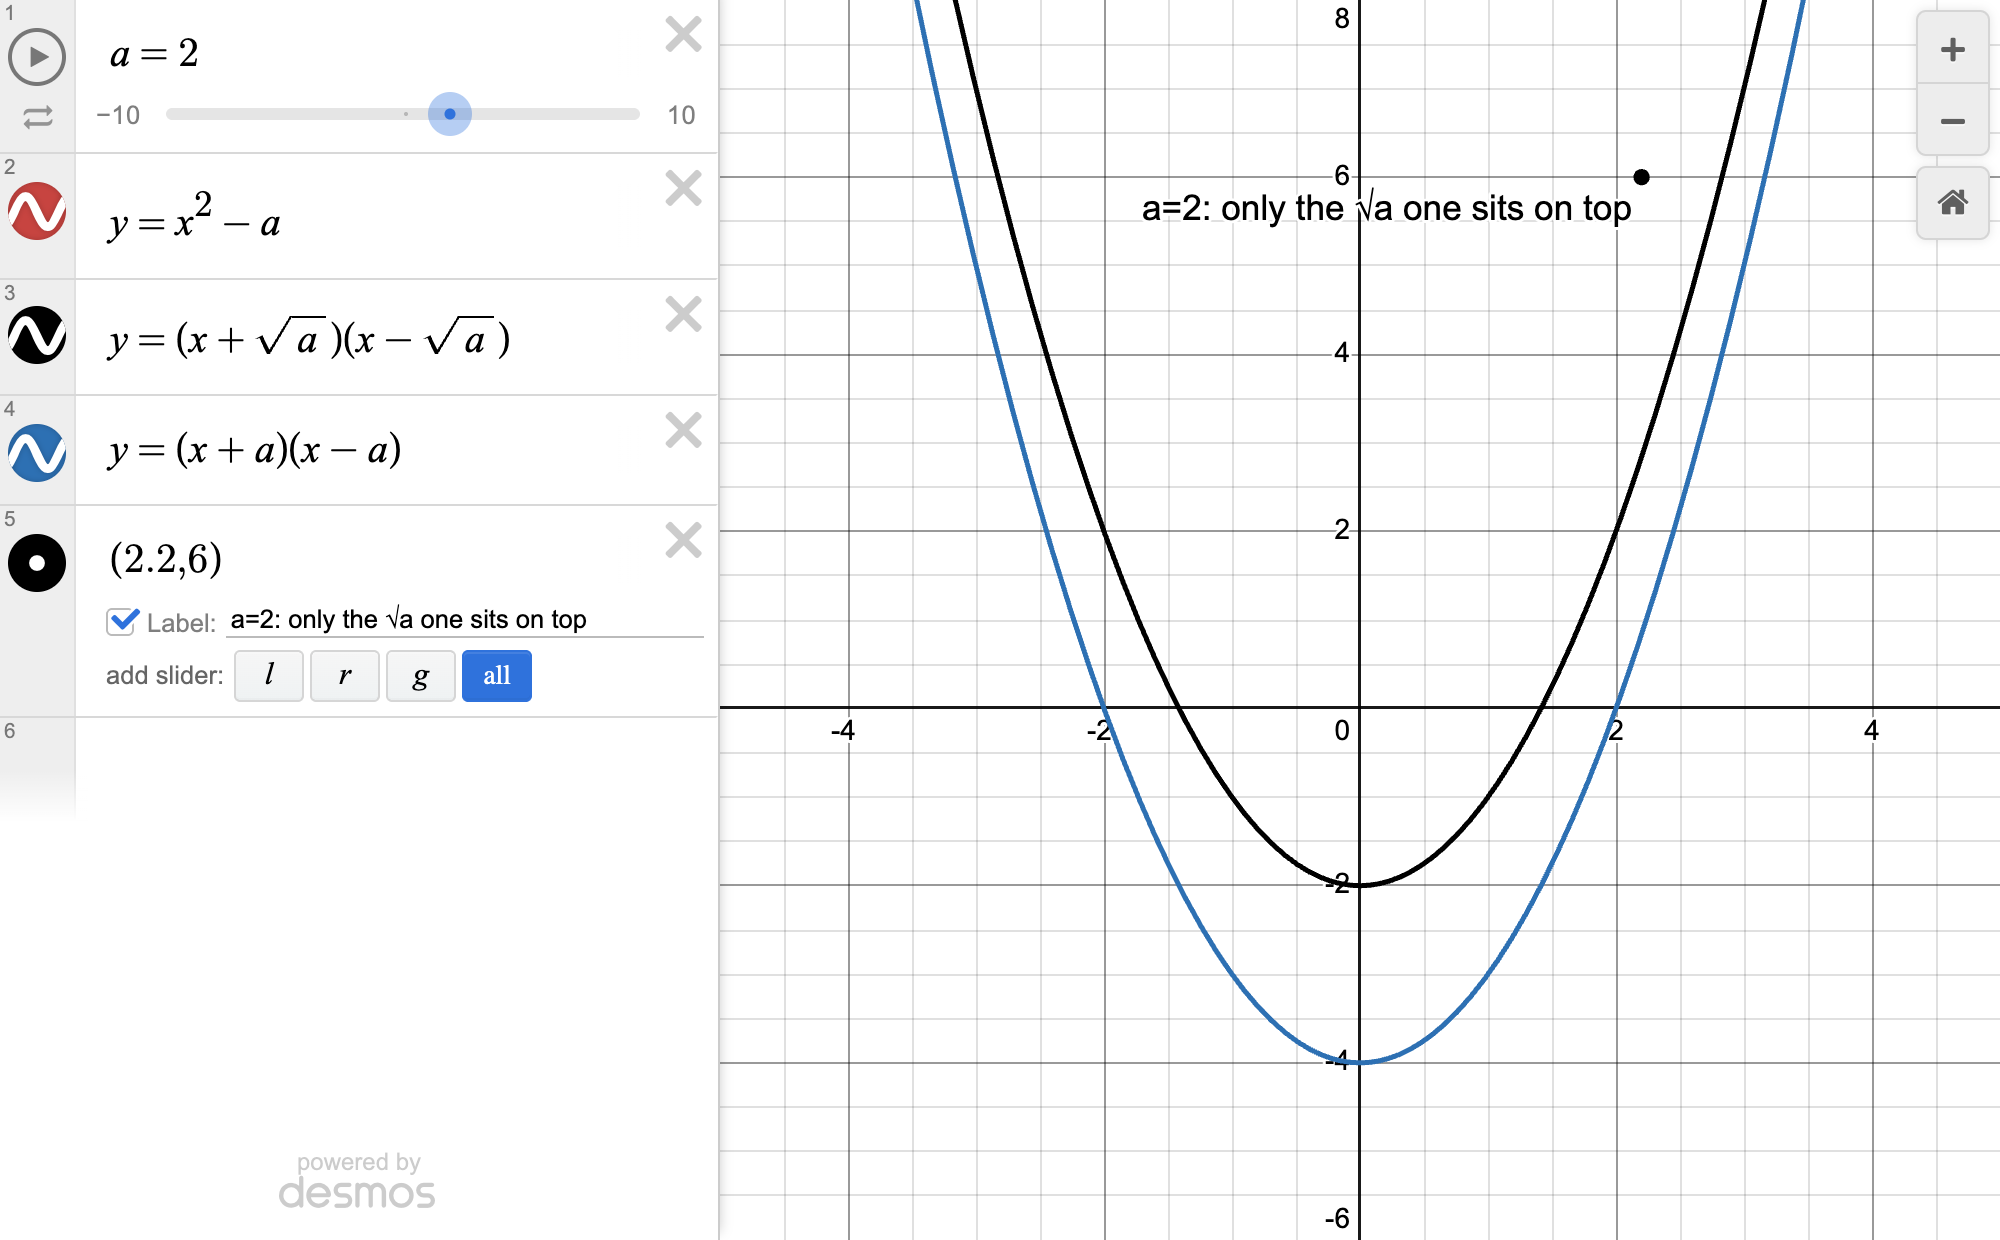
| Expression has a constant (a, k...) or you add any slider | Constants: never 0 or 1 |
| "Is ___ a factor of ___" / "divisible by" | Factor questions: same x-intercept |
| Deciding which Desmos method to use on any question | Flowchart: graph or regression? |
| Asks the y-intercept, y when x = 2, or f(2), and there's no extra = sign besides defining f | Basic graphing and f(2) |
| Using regression and not sure whether x needs to be a list | When x_1 needs a list |
| A scary question with lots of constants and no pattern you recognize | Meet every condition, then trust it |