Look at this every day before the test

Desmos, on one page

Every move from James Lu's "The Last SAT Desmos Guide You'll Need" (1h52m), in order, with what to type. The green-bordered ones are the must-knows. ▶ timestamps open the video at that exact spot.

Test-morning review

Read this once, top to bottom, before you start. About 10–15 minutes. Then close it and go.

Game plan (read first)

  • Module 1 decides everything. Slow down and get it right. Accuracy beats speed.
  • Point at what the question asks for (x or y? the total? 2x?) BEFORE you answer.
  • 2-minute cap. Stuck? Guess, flag it, move on. Come back if there is time.
  • Never leave a blank. Wrong answers cost nothing.
  • Math: put every question into Desmos, even the easy ones. Saves your brain for the hard ones.
  • Reading & Writing: you can jump around. Grammar, transitions and notes are at the back and fast.
  • Lost time on one question? Breathe. Do NOT rush the next five.

Reading & Writing — reading questions

  • WORDS IN CONTEXT: cover the choices, find the clue, say your own word, pick the match. However/but = opposite. In fact/indeed = same.
  • Don't know a word? Cross out the three you DO know are wrong. Fanciest word is not automatically right.
  • STRUCTURE / PURPOSE: give each sentence a job (claim, example, finding, contrast). Pick the choice that names the jobs in order.
  • CROSS-TEXT: one line per text ("T1 says X, T2 says Y"). The answer is about where they differ.
  • MAIN IDEA: what the WHOLE text is about, not one detail.
  • EVIDENCE: underline the claim's 2 key words. The right quote or data hits BOTH. Check every number against the table.
  • INFERENCE: the right answer is boring and 100% in the text. "Always / never / only" kills a choice.

Reading & Writing — grammar

  • SEMICOLON ; ONLY between two complete sentences. Can both sides stand alone? Yes → ; works.
  • COMMA , after an intro piece (Because I studied, I passed.) · around extra info, 2 commas · before and/but/so joining 2 sentences.
  • A comma ALONE can never join two complete sentences. Nothing between a subject and its verb.
  • Period and semicolon = same job. Both offered → both wrong.
  • Extra info opened with a dash → close with a dash. Comma → comma. Never mix.
  • VERBS: cross out the stuff between commas and "of ___". Match the verb to what is left. One thing → verb ends in -s.
  • it/its = one thing. they/their = many. its = belongs to it. it's = it is.

Reading & Writing — transitions + notes

  • TRANSITIONS: cover the choices. How does sentence 2 relate to sentence 1?
  • Same way: moreover, also, similarly · Opposite: however, but, instead · Result: therefore, thus, as a result · Example: for example · Proves it: in fact, indeed
  • Two choices that mean the same thing → both wrong.
  • NOTES QUESTIONS: read the goal FIRST ("The student wants to…"). CAPS the key word. Pick the choice that does exactly that goal, not just a true fact.

Math — Desmos moves

  • Any equation: y = left side, y = right side, click the crossing. The x is the answer.
  • System: type both equations, click the crossing (x, y). Read the one they ASK for.
  • Type it exactly as written. Fractions: after the bottom number press the RIGHT ARROW. (15 − x)^2 needs the parentheses.
  • How many solutions → count the crossings. No solution → lines never touch. Same line → infinitely many.
  • Which is equivalent → graph both. The right one sits exactly on top.
  • Unknown constant (k, a) → slider. Never test with 0 or 1.
  • Regression: type ~ instead of =. Desmos solves the unknown letters. Given points → table → y_1 ~ ...
  • Decimal but fraction choices → click the fraction button.

Math — word problems + lines

  • Name every letter in words first: t = hours, C = total cost.
  • y = mx + b: m = rate per one, b = starting amount. Flat fee is added ONCE.
  • "$950 for the first 3 hours, $50 per hour after" → 950 + 50(t − 3).
  • x-intercept: y = 0. y-intercept: x = 0 (the start).
  • Given a point or a value? Plug it in right away, for the RIGHT letter.
  • "Which equation represents…" → pick a number, do the story by hand, plug it into each choice.
  • Asks for 2x or n + 4? Find x, then plug it into what they ASKED for.

Math — rules to know

  • Triangle angles add to 180. Straight line = 180. Parallel lines → matching angles are equal.
  • Similar triangles → sides in the same ratio: small/small = big/big.
  • SOH CAH TOA: sin = opp/hyp, cos = adj/hyp, tan = opp/adj. sin(x) = cos(90 − x). Desmos: switch to DEGREES.
  • Side × k → area × k² → volume × k³. Formulas are on the reference sheet.
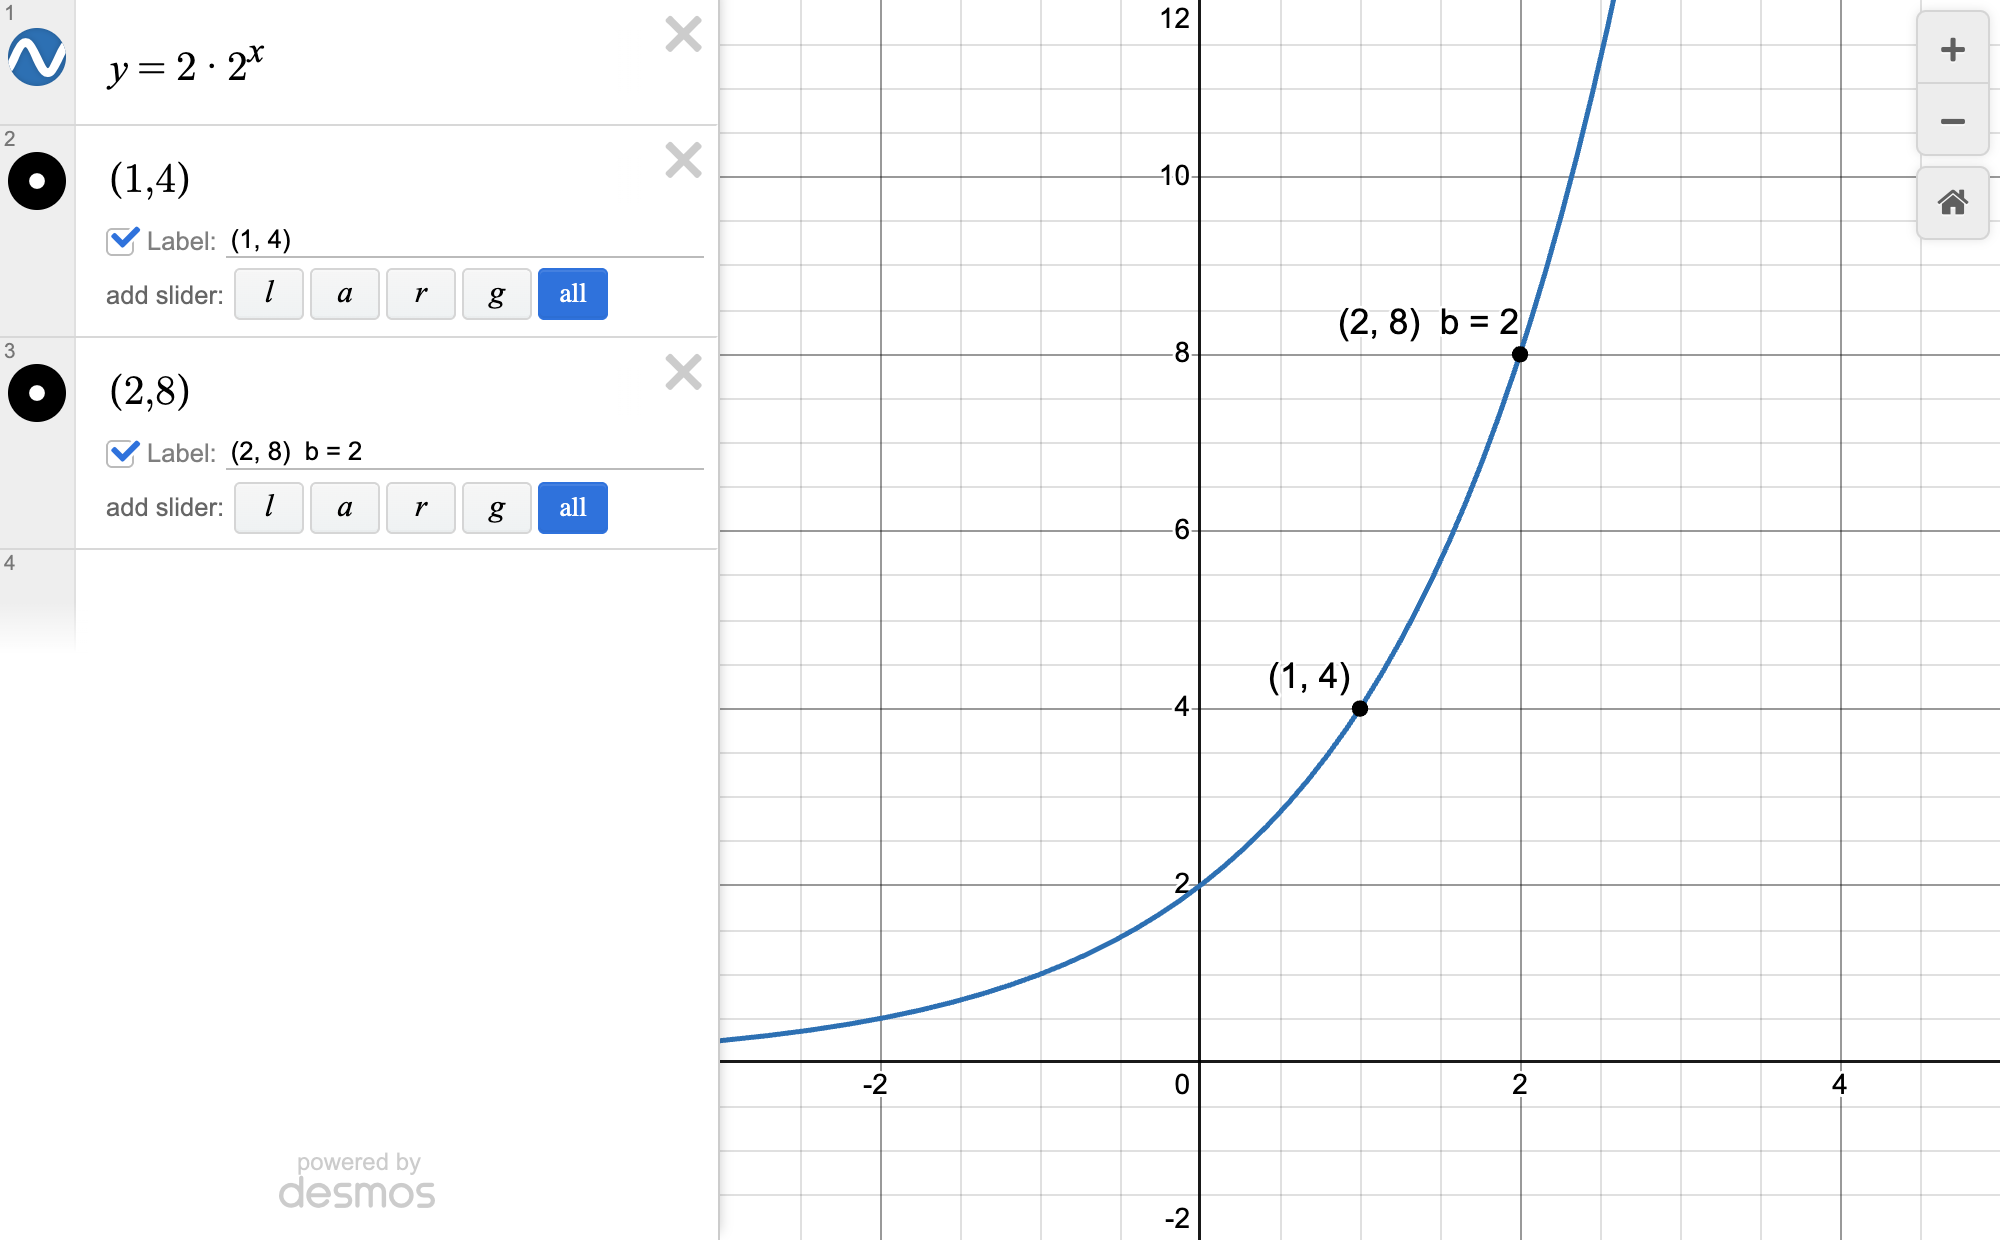
  • Exponential: start × factor^time. Up 20% → 1.2. Down 20% → 0.8. Doubles every 410 min → 2^(t/410), doubles at t = 410.
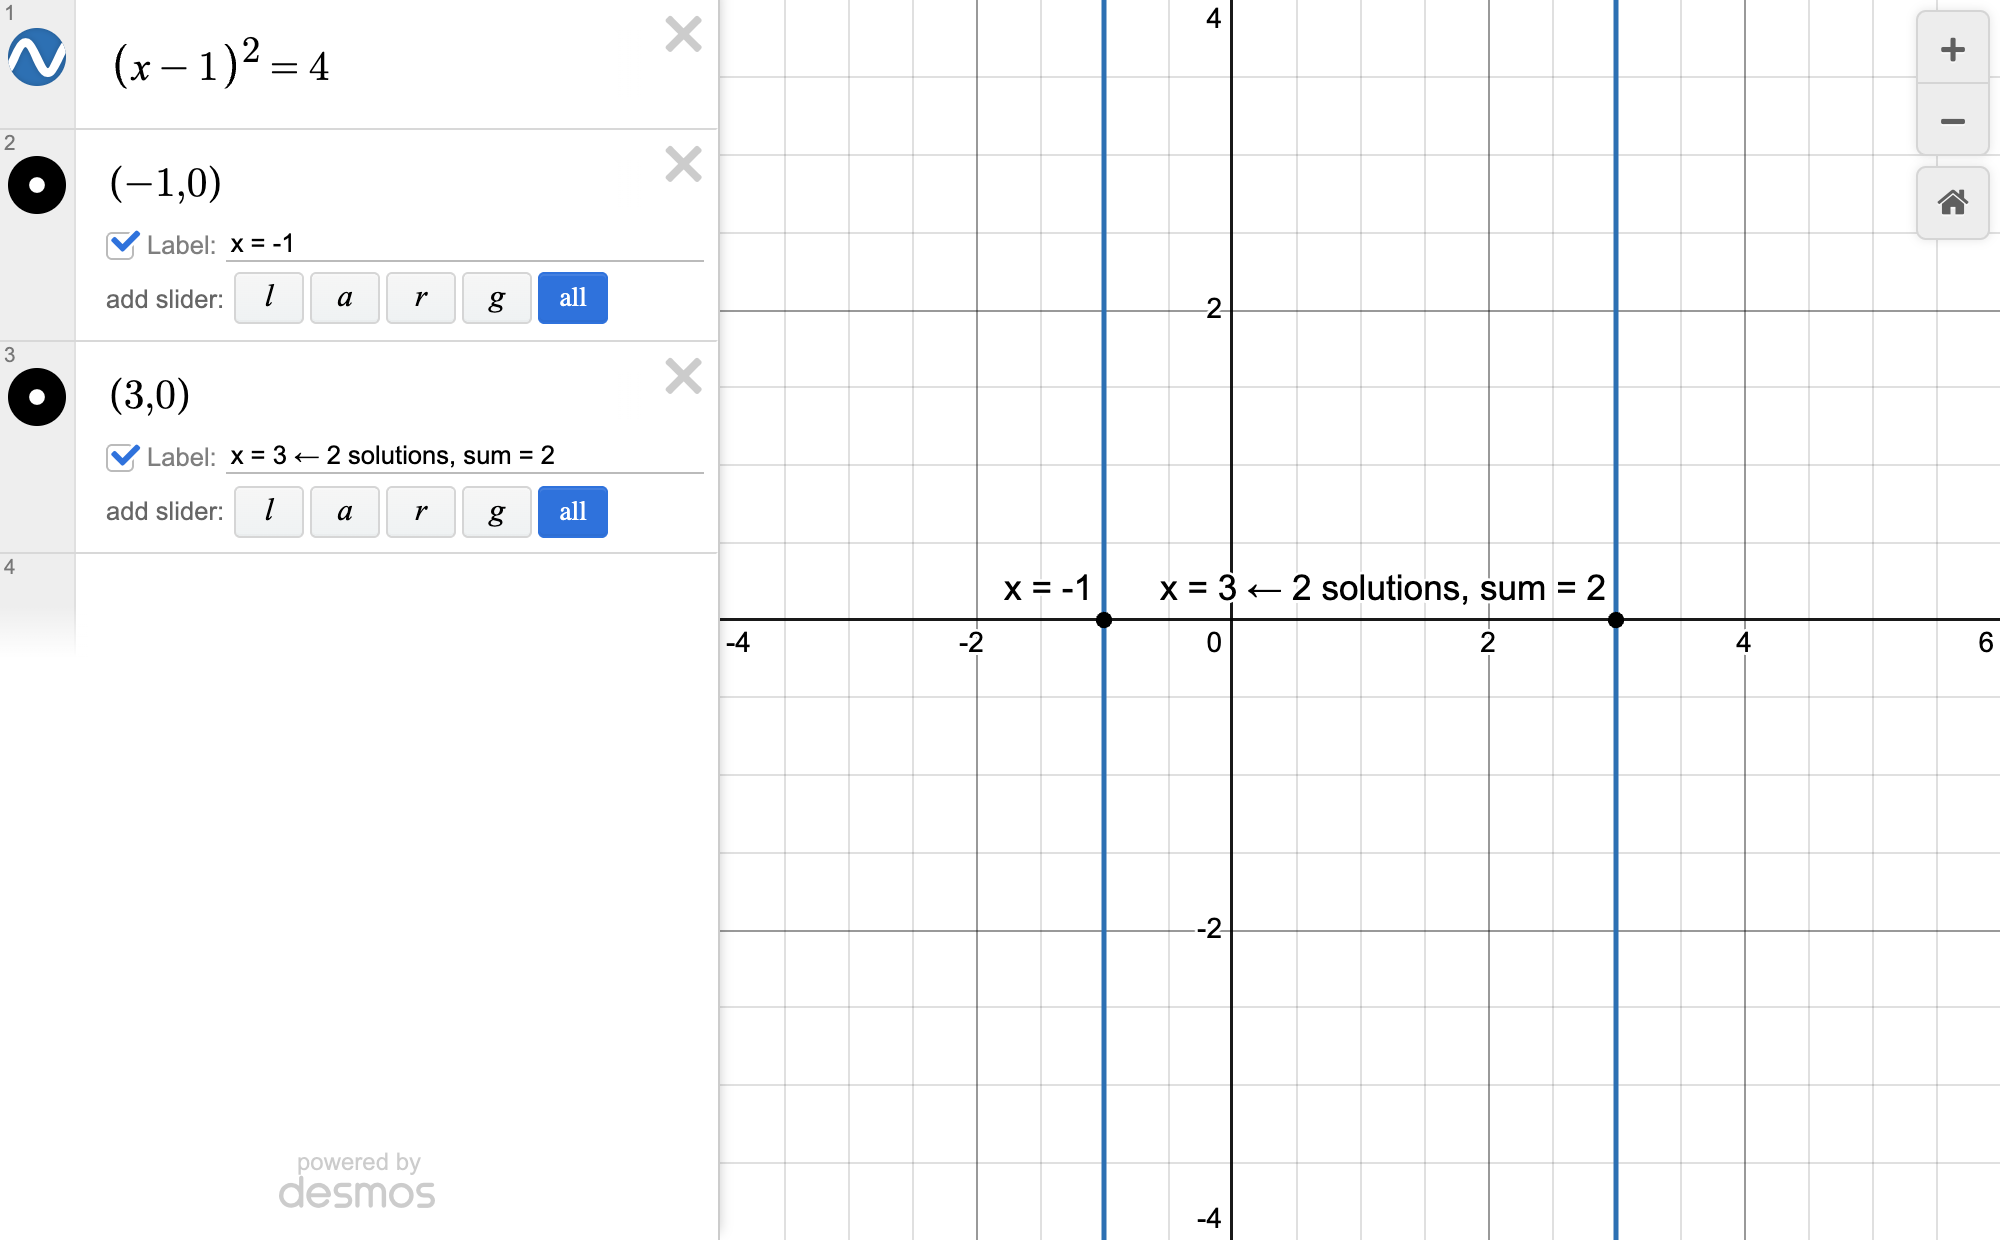
  • Quadratic: (stuff)² = positive → 2 solutions, = 0 → 1, = negative → 0.
  • Mean = total ÷ count. Median = middle after sorting. Desmos: mean(...), median(...).
  • Circles: (x − h)² + (y − k)² = r², where the right side is r SQUARED. Hard one? Guess and move on.

Your traps (from your own misses)

  • You found x when it asked for y (or 2x, or the total). Point at the ask.
  • You typed (15 − x)² without parentheses. Type exactly what you see.
  • You rushed Reading & Writing at 35 seconds each. You have about 70.
  • You matched a dash that wasn't closing extra info. Only match the opener.
  • You switched answers at the last second. First careful answer is usually right.
  • You multiplied area by 6 instead of 36. Area scales by k².
  • Apostrophes: playa's = ONE playa owns it ('s). rocks' = MANY rocks own it (s'). No ownership = no apostrophe. (Mock 9/30, R&W M1 Q18.)
  • Notes question with a two-part goal (e.g. "explain X AND give an example"): the answer must hit BOTH parts.

Overview

  • He got an 800 on SAT Math and finished with 14 minutes left, all because of Desmos.
  • Over half of SAT Math questions can be solved with Desmos from start to end.
  • Regression alone solves roughly 24-30% of the math section.
  • Bluebook calculator = regular Desmos; the only extra you need from the + menu is Table.
  • Video plan: all Desmos basics, then regression in depth, then if-you-see-this-do-this patterns, flowchart, theory.

The must-knows (16)

1Click gray points on graphsQuestion asks for an intercept, max/min (vertex), or intersectiony=|x-2|3One-variable equation = vertical linesEquation has only x (no y); asks for x or an expression in x<the equation exactly as given, in x>5Sliders for unknown constantsQuestion asks what value of a constant makes a graph pass through a point (or similar)y=ax^26Function notation does it allQuestion uses f(x), g(x), f(2), f(x+2), or combos of functionsf(x)=<given equation>13Decimal to fraction buttonAnswer choices are fractions but Desmos shows a decimal19Switch to DEGREES for trigAny trig question with angles in degreessin(30)20Regression solves any equationYou have an equation (something = something) and need x or an expression with x<left side with x1> ~ <right side with x1>21Multiple solutions: graph insteadQuestion asks how many solutions, sum of solutions, or greatest/least possible value<equation in x>32Points anywhere means use a tableGraph with points, listed points, or function notation like f(2)=8table47System of equations: graph itTwo equations in x and y; asks for x, y, or something like x − y[equation 1]50No solutions: lines never touch"For what value of k does the system/equation have no solution?"y=\frac{1}{4}x51Always split into two linesANY question about the NUMBER of solutions (none, one, infinite, how many)y=[everything left of =]52Infinite solutions: use regressionThe question SAYS the equation has infinitely many solutions and asks for a constantx_1=[1,2,3]55Equivalent expressions: overlap test"Which expression is equivalent to..." (any expression, pick the matching choice)y=[given expression]56Constants: never 0 or 1Expression has a constant (a, k...) or you add any slidera=258Flowchart: graph or regression?Deciding which Desmos method to use on any question

If the question says… → use this

Question asks for an intercept, max/min (vertex), or intersectionClick gray points on graphs
Question asks which point is a solution to an inequality or systemInequalities: dashed vs solid
Equation has only x (no y); asks for x or an expression in xOne-variable equation = vertical lines
The unknown is a letter other than x (like a, t, n) and you want to graph itRename unknown to lowercase x
Question asks what value of a constant makes a graph pass through a point (or similar)Sliders for unknown constants
Question uses f(x), g(x), f(2), f(x+2), or combos of functionsFunction notation does it all
You have several points to plot, or a point is way off-screenTables for points + Zoom Fit
Question gives points and asks for the line/curve through themAdd regression from a table
You need to reuse a line (no copy-paste) or check if one graph hides anotherEdit list: duplicate, color, toggle
Question asks the y-value (output) at a specific xCreate table: y for any x
Question gives an equation and asks for an equivalent form (e.g. standard vs vertex/factored)Convert equation to another form
Question needs the whole-number factors of a numberFind factors with number/x
Answer choices are fractions but Desmos shows a decimalDecimal to fraction button
Question asks mean, median, standard deviation, distance, midpoint, percent, or greatest common factorBuilt-in stats/geometry functions
Rarely needed; there's usually an easier wayHonorable mentions (optional)
Any time you enter roots, pi, fractions, or exponentsType, don't use the keypad
You need a graph only on part of its domain, or only positive/negative solutionsCurly brackets set constraints
You'll use the same data set more than once (mean and median of same list)Square brackets make lists
Any trig question with angles in degreesSwitch to DEGREES for trig
You have an equation (something = something) and need x or an expression with xRegression solves any equation
Question asks how many solutions, sum of solutions, or greatest/least possible valueMultiple solutions: graph instead
Question says expressions are equivalent / true for all x and asks for a constant (a, b, k)Solve for constants: x1=[1...10]
"A solution to the equation is x = ___" plus unknown constantsGiven solution: set x_1 to it
"k is a positive constant", "p > 1", any condition the answer must meetForce conditions with curly braces
Two or more equations share unknowns (system of equations, chained percent statements)Systems: bracket list regression
Hard percent word problems: "A is __% of B, B is __% of C... what is Q?"Percent chains: "is" means =
Any bracket (multi-equation) regression, especially when starting outCheck with L and R lists
Several equations and "N is a constant" (so the other letters are variables)Multi-equation: vary one variable by hand
Desmos returns a long messy decimal for the answerUgly decimal = probably wrong
After setting one variable to a number, you're tempted to set the others tooDon't over-define the variables
Hardest type: constant changes when you change x, even with bracket regressionConstant changes? Make one equation
Graph with points, listed points, or function notation like f(2)=8Points anywhere means use a table
One of the points holds the thing you're solving for (e.g. (k, 0))Never graph the unknown point
The equation's form matches a preset (a·b^x, linear, standard quadratic)Dropdown regression when form matches
Question gives points AND the equation that goes through themCustom regression in 3 steps
Points given but NO equation: "passes through a circle" or "maximum/minimum"Memorize circle and vertex form
"A circle passes through these points... find k" where one point is unknownCircle through points
Word problem says "maximum height" / "minimum" and it's a quadraticVertex form for max/min
Picking points off a graph for a regression, or regression gives a wrong curvePoints needed = constants to find
Answer choices look like ax + by = c (line in standard form)Standard-form line: fix one constant
Question says the equation contains the points, but the regression misses themBad fit? Add +0.0001
Regression ignores your table, or you added a second tableTable = x_1, y_1 lists
Regression won't give a value for the letter you wantDefined constants won't be solved
You're using ~ regression to solve for a constant that already has a value elsewhere in DesmosRegression letters must be undefined
"Which equation correctly expresses R in terms of P, Q, and F?" (get one letter by itself)Isolation: plug-in numbers check
An expression equals an expression, OR the question gives points (or a graph you can read points from)When regression works
Two equations in x and y; asks for x, y, or something like x − ySystem of equations: graph it
"Sum of the solutions", "greatest solution", "least possible solution"Sum/greatest of solutions: graph
"How many solutions" / "exactly one solution" / answer choices like 0, 1, 2, infinitely manyCount solutions = count crossings
"For what value of k does the system/equation have no solution?"No solutions: lines never touch
ANY question about the NUMBER of solutions (none, one, infinite, how many)Always split into two lines
The question SAYS the equation has infinitely many solutions and asks for a constantInfinite solutions: use regression
Given a circle equation, asks for the radius (or diameter)Circle radius: max to min
Asks for the center, or which point is inside the circleCircle center + inside points
"Which expression is equivalent to..." (any expression, pick the matching choice)Equivalent expressions: overlap test
Expression has a constant (a, k...) or you add any sliderConstants: never 0 or 1
"Is ___ a factor of ___" / "divisible by"Factor questions: same x-intercept
Deciding which Desmos method to use on any questionFlowchart: graph or regression?
Asks the y-intercept, y when x = 2, or f(2), and there's no extra = sign besides defining fBasic graphing and f(2)
Using regression and not sure whether x needs to be a listWhen x_1 needs a list
A scary question with lots of constants and no pattern you recognizeMeet every condition, then trust it

Desmos Basics

1

Click gray points on graphs

▶ 2:04

Use it when: Question asks for an intercept, max/min (vertex), or intersection

Type into Desmos
1y=|x-2|
  1. Type the equation(s) exactly as given.
  2. Click the graph: gray dots show x/y-intercepts, vertex, and intersections.
  3. Click a dot to read its coordinates; export it to the list if you need to reuse it.

His example: Even absolute value graphs show every intercept and the vertex automatically.

2

Inequalities: dashed vs solid

▶ 2:32

Use it when: Question asks which point is a solution to an inequality or system

Type into Desmos
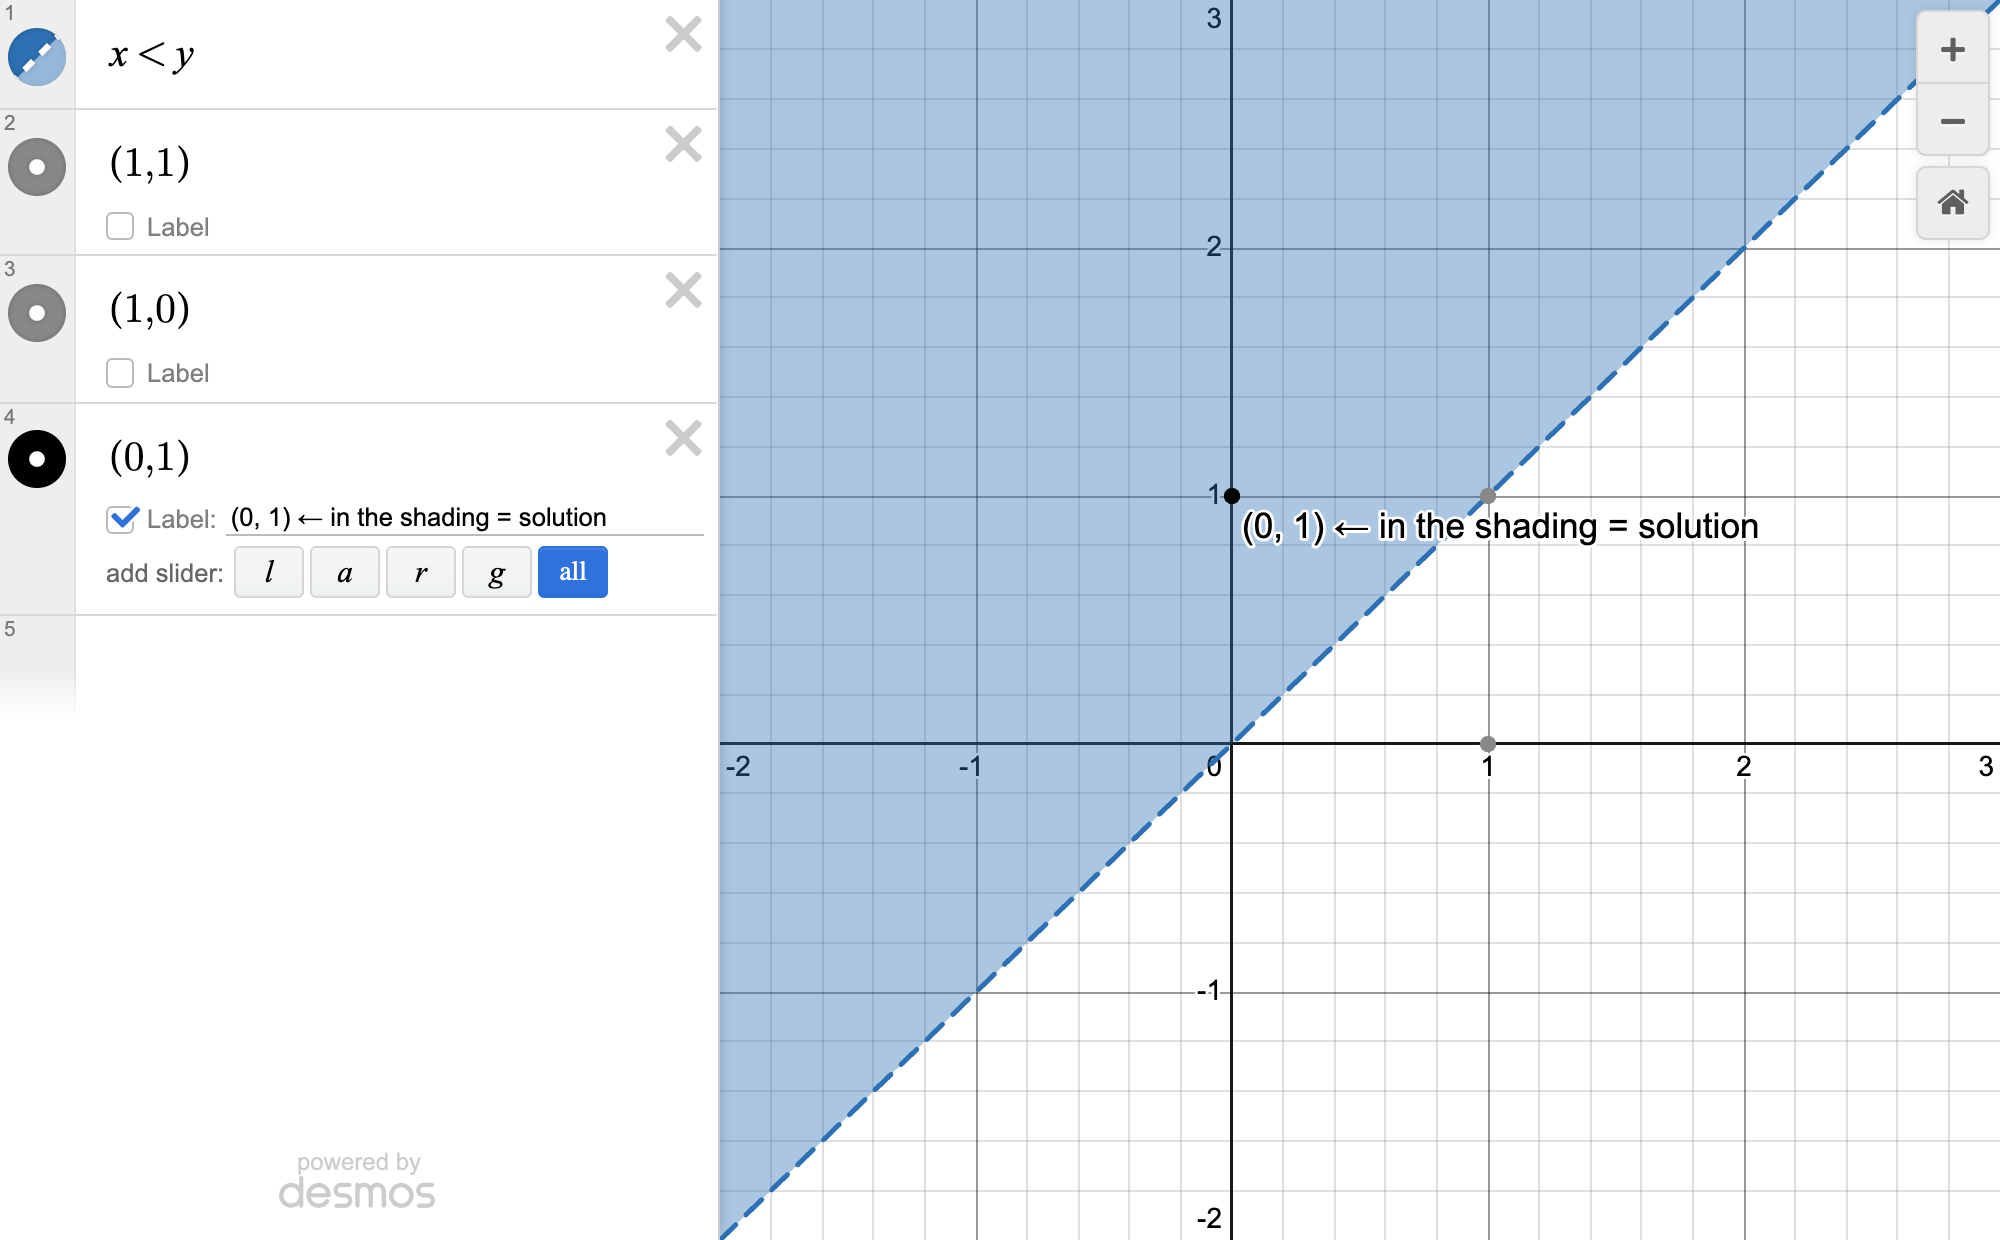
1x<y
22x<y
3(0,1)
4(1,1)
5(1,0)
  1. Type each inequality; the shaded region is the solution.
  2. For a system, the answer is the DOUBLE-shaded overlap.
  3. Type each answer-choice point and see which lands in the shading.
  4. Zoom in on any point near the boundary line.
Desmos screen for Inequalities: dashed vs solid
What your Desmos screen looks like (example numbers)

His example: For x<y with points (0,1),(1,1),(1,0): only (0,1) is a solution; (1,1) sits on the dashed line.

Trap: Dashed line (< or >) = points ON the line are NOT solutions. Solid (<= or >=) = they are. About 1 in 4 of his students miss this by not zooming in. Type = after < to get <=.

3

One-variable equation = vertical lines

▶ 3:44

Use it when: Equation has only x (no y); asks for x or an expression in x

Type into Desmos
1<the equation exactly as given, in x>
  1. Type the equation with only x in it.
  2. It graphs as vertical line(s); each line's x-value is a solution.
  3. Plug that x into whatever the question actually asks for.
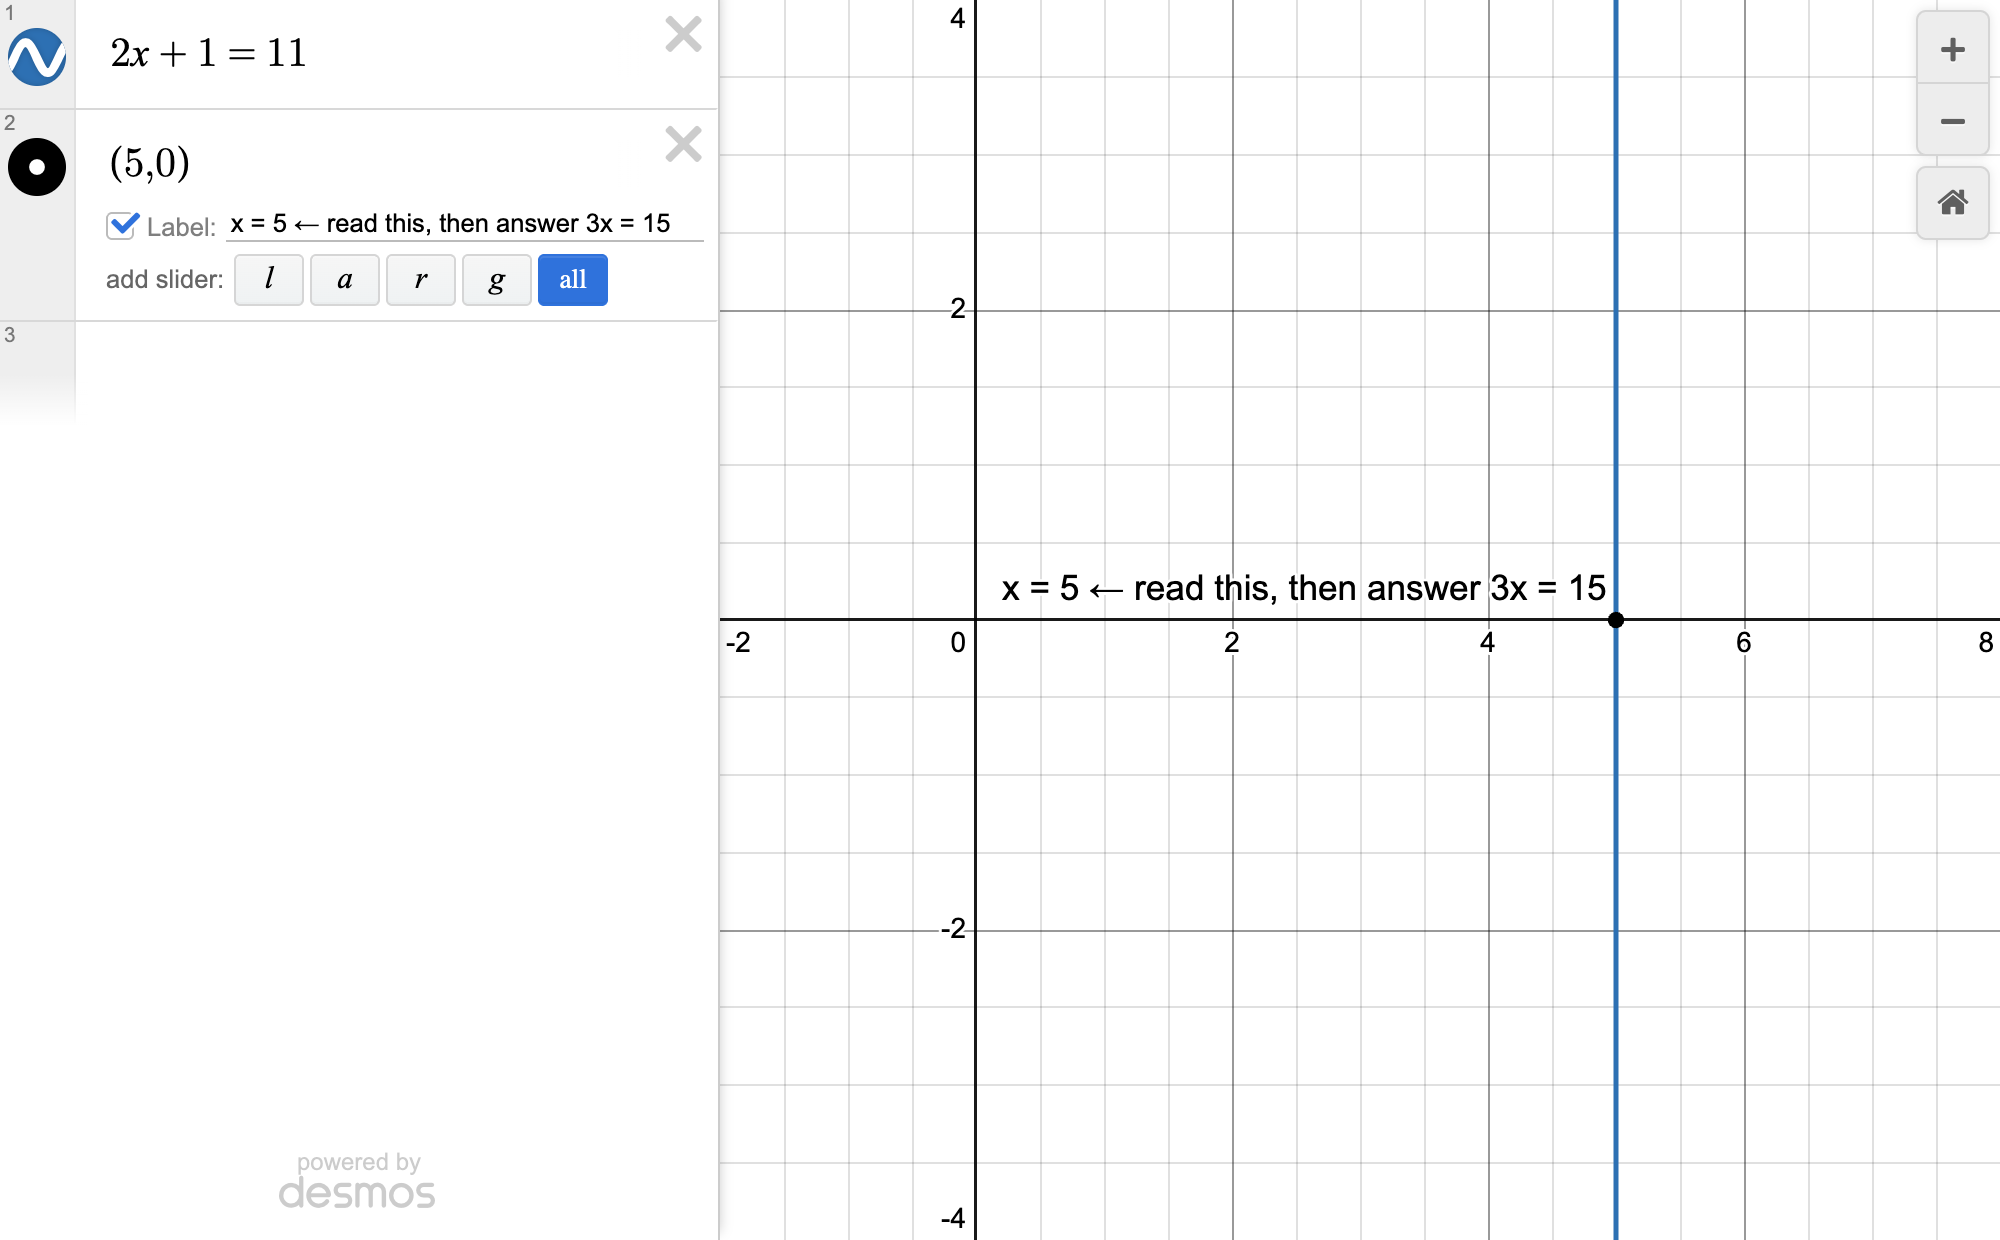
Desmos screen for One-variable equation = vertical lines
What your Desmos screen looks like (example numbers)

His example: Vertical line landed at x=5; question asked for 3x, so 3(5)=15.

4

Rename unknown to lowercase x

▶ 4:20

Use it when: The unknown is a letter other than x (like a, t, n) and you want to graph it

Type into Desmos
1<equation with the letter replaced by x>
  1. Swap the question's letter for lowercase x.
  2. Graph it and read the vertical line(s).

His example: Replacing x with a in the same equation: nothing graphs at all.

Trap: Only lowercase x graphs reliably. Uppercase X does nothing; a lone lowercase y errors unless there is an equals sign with it.

5

Sliders for unknown constants

▶ 5:34

Use it when: Question asks what value of a constant makes a graph pass through a point (or similar)

Type into Desmos
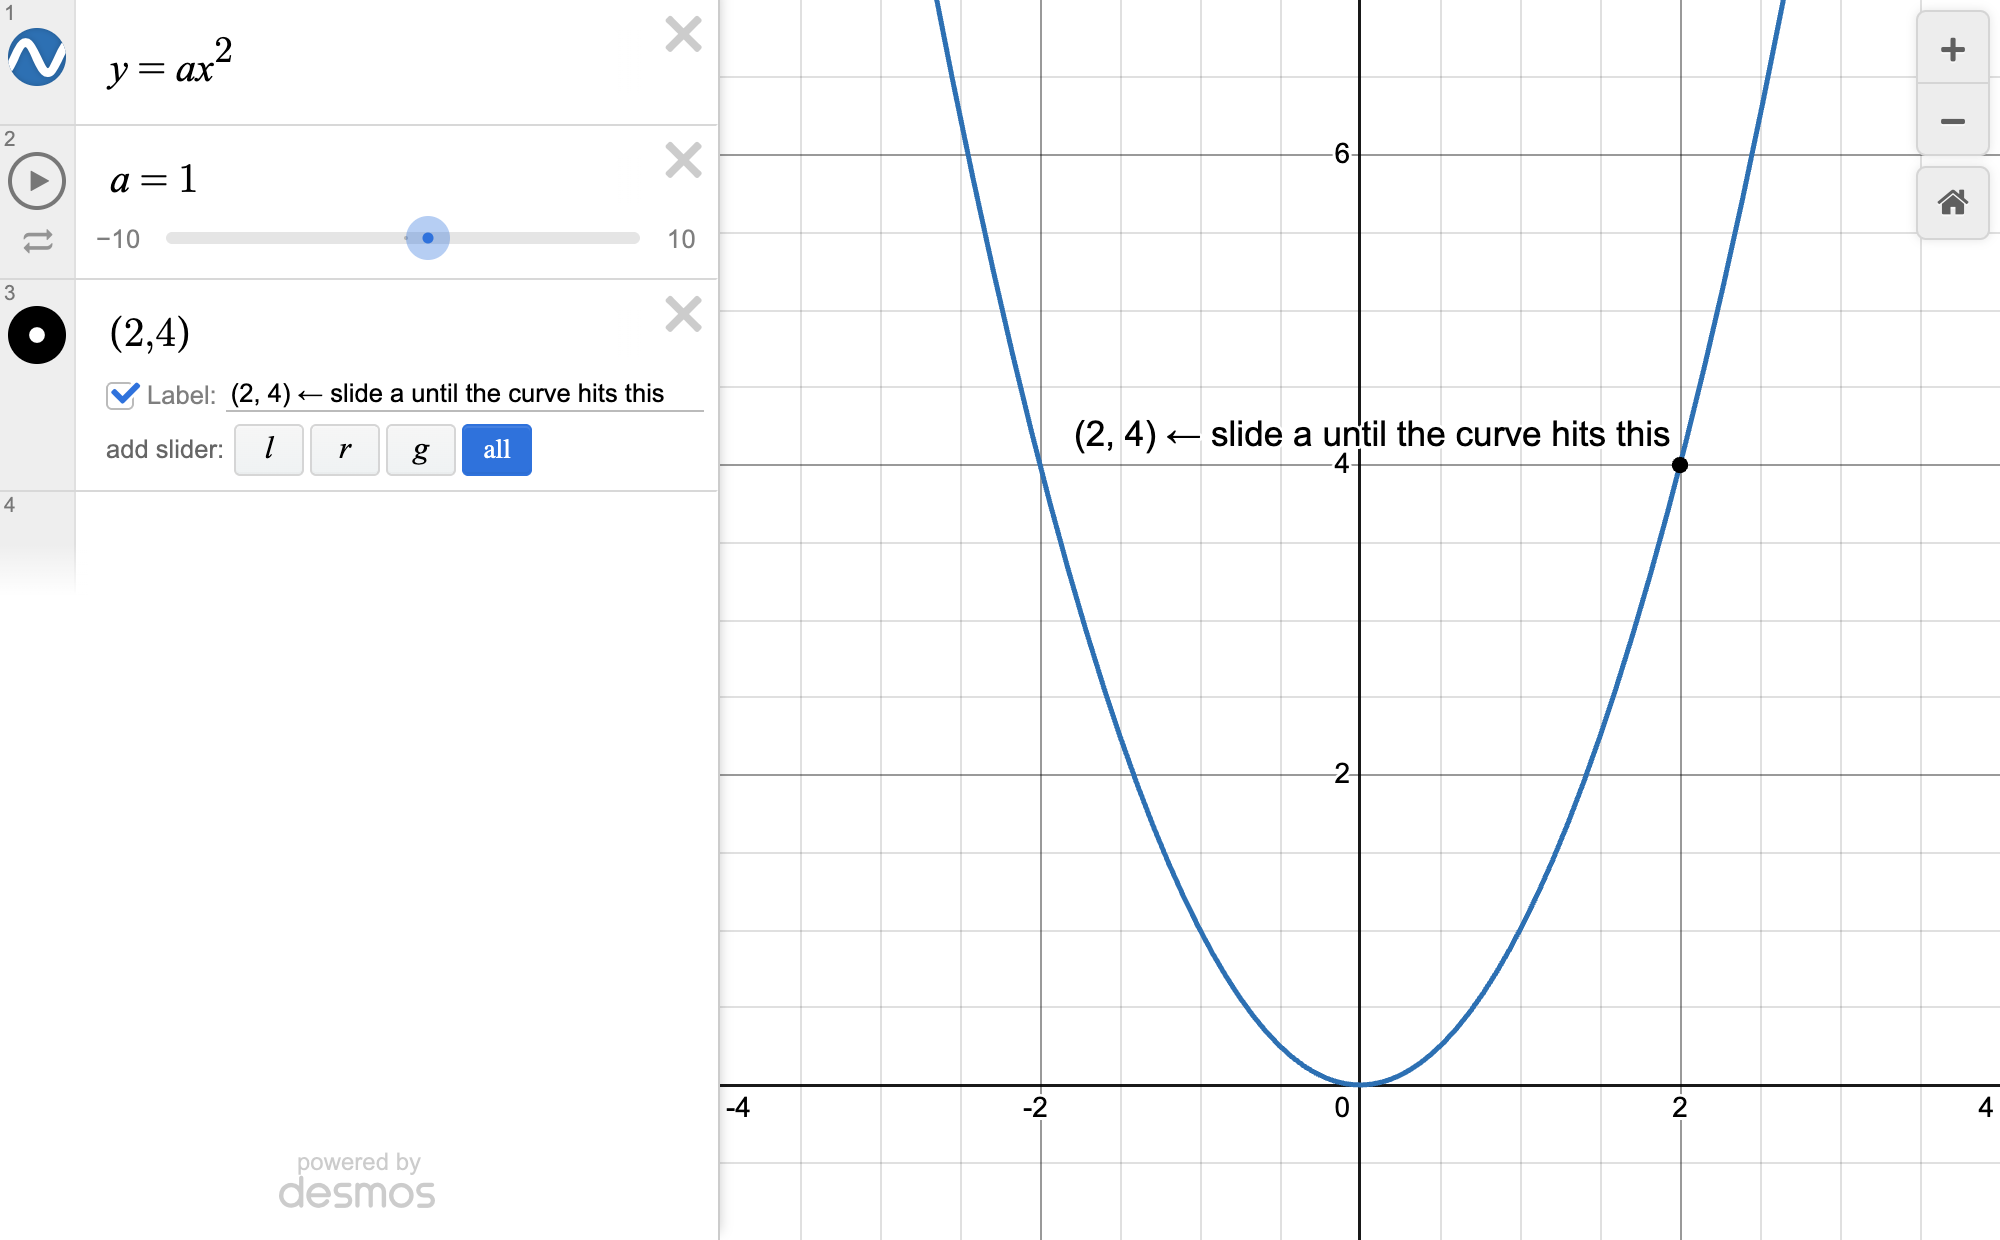
1y=ax^2
2a=1
3(2,4)
  1. Type the equation with the constant, then type a=<number> to make a slider.
  2. Type the given point.
  3. Drag the slider (or type values) until the graph hits the point.
  4. Read the constant's value = answer.
Desmos screen for Sliders for unknown constants
What your Desmos screen looks like (example numbers)

His example: Moved the slider until the graph went through the point: a=1.

Trap: No sliders for x, y, or e (e = 2.718...). Write letter=number, not number=letter. Don't define the same constant twice (error). Default range is -10 to 10 and step 0.1; click the bounds to widen or set step 1. He usually TYPES values instead of dragging because it's faster.

6

Function notation does it all

▶ 9:18

Use it when: Question uses f(x), g(x), f(2), f(x+2), or combos of functions

Type into Desmos
1f(x)=<given equation>
2f(2)
3f(x+2)
4g(x)=<given equation>
5g(3)*f(2)
  1. Define f(x)=... once (replaces copy-paste, which Bluebook blocks).
  2. Type f(2) and Desmos plugs in and prints the value.
  3. Type f(x+2) etc. and it graphs the transformation for you.
  4. Combine functions freely, e.g. g(3)*f(2).

His example: f(x+2) shifted the graph 2 to the left automatically.

Trap: You must define f(x) first, or f(2) means nothing. Copy/paste does NOT work in Bluebook, so practice without it.

7

Tables for points + Zoom Fit

▶ 11:40

Use it when: You have several points to plot, or a point is way off-screen

Type into Desmos
1table
  1. Type table (or + then Table) and enter x and y values.
  2. Press Zoom Fit (magnifier) to fit all points on screen.
  3. Press the home button to reset to the default view.

Trap: Table points accept defined constants (e.g. b) but you must define b first or it errors.

8

Add regression from a table

▶ 13:00

Use it when: Question gives points and asks for the line/curve through them

Type into Desmos
1table
2<x1 y1 columns filled in>
  1. Enter the points in a table.
  2. Press 'add regression' under the table.
  3. Pick linear, quadratic, or maybe exponential from the dropdown (ignore the rest).
  4. Read the equation; three dots > export as custom regression gives named constants.

Trap: If the equation isn't in a ready-made template form, you'll need a manual custom regression (taught later).

9

Edit list: duplicate, color, toggle

▶ 14:58

Use it when: You need to reuse a line (no copy-paste) or check if one graph hides another

  1. Undo/redo = Ctrl/Cmd+Z and Ctrl/Cmd+Shift+Z.
  2. Edit list (pencil) > duplicate any line instead of copy-paste.
  3. In edit mode click the color dot to change color; outside edit mode it turns the graph on/off.
  4. Toggle a graph off to see if another graph sits underneath.

Trap: Edit mode also has Delete All (undo it if you slip).

10

Create table: y for any x

▶ 15:58

Use it when: Question asks the y-value (output) at a specific x

Type into Desmos
1y=<equation in x>
  1. Type the equation.
  2. Edit list > create table.
  3. Type the x you need in the table; y fills in.

His example: Changed an x-value to 8 and the table showed the y-value instantly.

Trap: Only works for plain equations with x on one side (y=... form). You can only edit x, not y. Also converts a typed point into a table.

11

Convert equation to another form

▶ 17:12

Use it when: Question gives an equation and asks for an equivalent form (e.g. standard vs vertex/factored)

Type into Desmos
1y=<given equation>
  1. Type the given equation.
  2. Edit list > create table.
  3. Add regression > switch to quadratic (match the equation type).
  4. Read the coefficients and match the answer choice.

His example: About 5 seconds per question this way.

12

Find factors with number/x

▶ 17:45

Use it when: Question needs the whole-number factors of a number

Type into Desmos
1y=32/x
  1. Type <number>/x.
  2. Edit list > create table.
  3. Click the last row and hold Enter to fill rows.
  4. Read the whole-number pairs; stop when pairs start repeating.

His example: 32/x gave pairs 1&32, 2&16, 4&8; then 8&4 repeats, so that's all.

13

Decimal to fraction button

▶ 18:59

Use it when: Answer choices are fractions but Desmos shows a decimal

  1. Look for the fraction button next to the output.
  2. Click it to convert the decimal to a fraction.
14

Built-in stats/geometry functions

▶ 19:12

Use it when: Question asks mean, median, standard deviation, distance, midpoint, percent, or greatest common factor

Type into Desmos
1mean(1,2,3)
2median(1,2,3)
3stdev(1,2,3)
4distance((1,1),(2,2))
5midpoint((1,1),(2,2))
64% of 10
7gcd(3,12,6)
  1. Type the function name, open parenthesis, then the numbers or points.
  2. distance/midpoint take two points separated by a comma.
  3. % is Shift+5; type '4% of 10'.
  4. gcd = greatest common factor of a list.

His example: gcd(3,12,6) finds the greatest common factor; midpoint also plots the point.

Trap: No need to memorize the distance formula; just type distance(). He says memorize these (gcd through mean).

15

Honorable mentions (optional)

▶ 20:46

Use it when: Rarely needed; there's usually an easier way

Type into Desmos
1mod(7,3)
2min(1,2,3)
3max(1,2,3)
4floor(3.5)
5ceil(3.5)
6round(4.5)
  1. mod = remainder of first number divided by second.
  2. min/max of a list.
  3. floor rounds down, ceil rounds up, round rounds normally.

His example: floor(3.5)=3; round(4.5)=5, round(4.4)=4.

Trap: You don't need these for a 1600.

16

Type, don't use the keypad

▶ 21:57

Use it when: Any time you enter roots, pi, fractions, or exponents

Type into Desmos
1sqrt
2cbrt
3nthroot
4pi
5table
64*3
74/3
8x^(a+b)
  1. Type sqrt, cbrt, nthroot, pi, table: they auto-convert.
  2. * (Shift+8) = multiply; / = fraction; ^ (Shift+6) = exponent.
  3. Exponent with + or -: type ( first, then the terms, so they stay in the exponent.
  4. Multi-term numerator: highlight it all, THEN press /.

His example: Typing 5+4 then / only puts the 4 on top; highlight 5+4 first.

Trap: Without parentheses, pressing + in an exponent drops you out of the exponent. Only use the keypad if testing on an iPad with no keyboard.

17

Curly brackets set constraints

▶ 25:13

Use it when: You need a graph only on part of its domain, or only positive/negative solutions

Type into Desmos
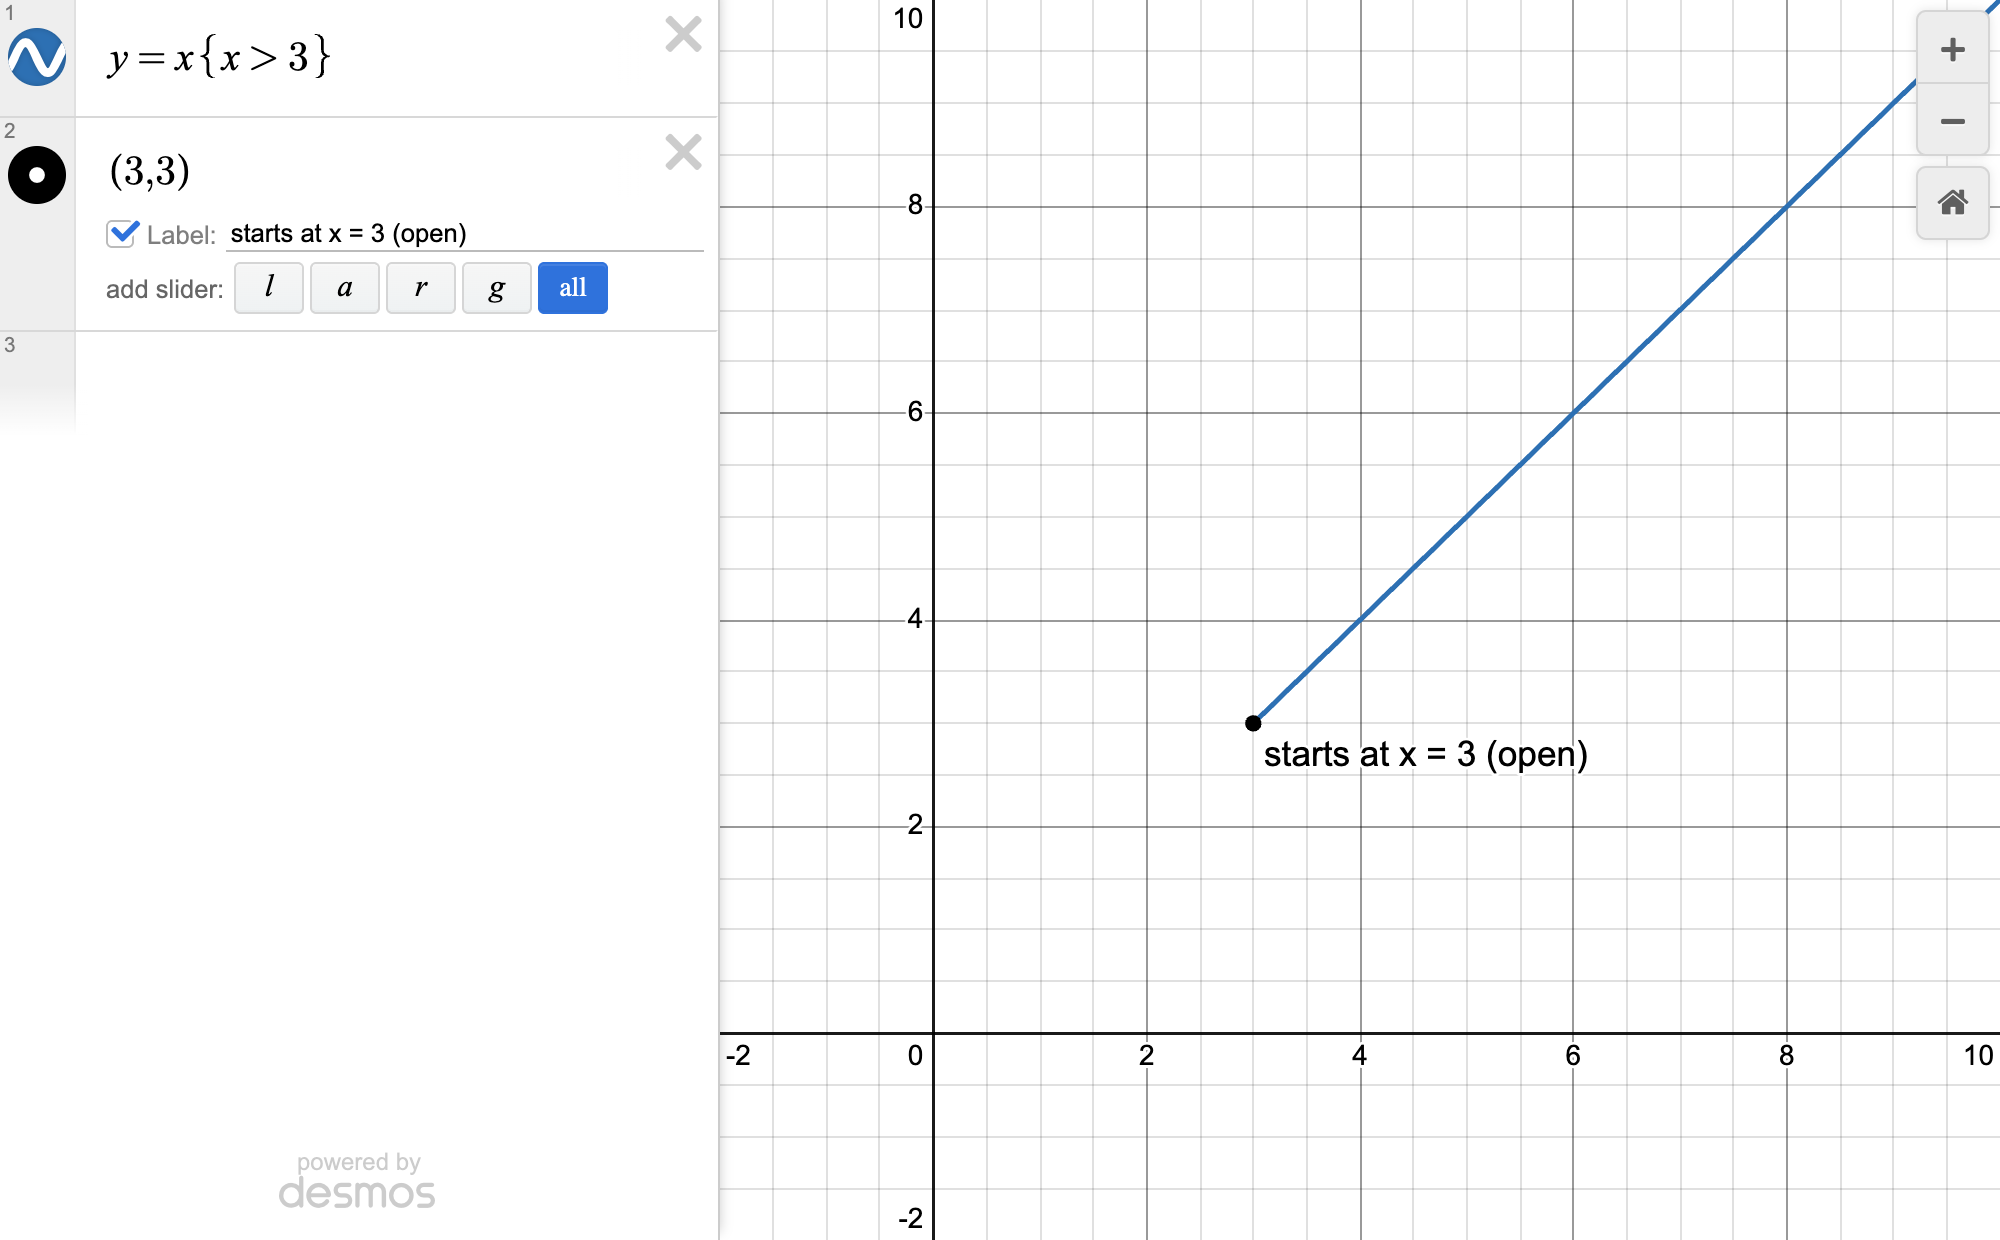
1y=x{x>3}
  1. Type the equation.
  2. Right after it, type { and the condition.
  3. Only that part graphs.
Desmos screen for Curly brackets set constraints
What your Desmos screen looks like (example numbers)

His example: y=x{x>3} graphs only where x is greater than 3.

18

Square brackets make lists

▶ 25:44

Use it when: You'll use the same data set more than once (mean and median of same list)

Type into Desmos
1a=[1,2,3,4]
2mean(a)
3median(a)
  1. Name the list once with square brackets.
  2. Reuse the name in mean(a), median(a), etc.

Trap: Outside a function, a list needs square brackets or Desmos won't know what it is.

19

Switch to DEGREES for trig

▶ 26:23

Use it when: Any trig question with angles in degrees

Type into Desmos
1sin(30)
  1. Click the wrench (graph settings).
  2. Change Radians to Degrees.
  3. Re-check your answer.

His example: Same input gave about 7 in radians and exactly 1 in degrees; the nice number is the answer.

Trap: Desmos defaults to RADIANS. SAT angles are usually in degrees, so a wrong mode gives a wrong answer with no warning.

Regression

20

Regression solves any equation

▶ 27:25

Use it when: You have an equation (something = something) and need x or an expression with x

Type into Desmos
1<left side with x1> ~ <right side with x1>
23x_1-2
  1. Retype the equation, changing every x to x1 (type x then 1 for the subscript).
  2. Replace = with ~ (Shift + key under Esc).
  3. Desmos shows x1 = the solution.
  4. Plug x1 into what the question actually asks.

His example: Solved and got x1 = -2/3, but the question asked for 3x-2, so the answer was -4 (picking -2/3 is the trap choice).

Trap: Only constants work in regression: lowercase x or y errors, so use x1. If the result is an ugly decimal, you probably set it up wrong. No equals sign in the question (e.g. just 'f(x)=...' then 'find f(-1)') = no regression; just evaluate f(-1).

21

Multiple solutions: graph instead

▶ 29:50

Use it when: Question asks how many solutions, sum of solutions, or greatest/least possible value

Type into Desmos
1<equation in x>
  1. Don't use regression: it returns only ONE solution.
  2. Graph the equation (with x) and read every vertical line/intersection.
  3. Optional: regression twice with {x1>0} and {x1<0} to force each root.
Desmos screen for Multiple solutions: graph instead
What your Desmos screen looks like (example numbers)

His example: Squared equation had two solutions on the graph, but regression only reported one.

Trap: Regression tends to favor smaller-absolute-value and whole-number answers, so it silently skips the others.

22

Solve for constants: x1=[1...10]

▶ 32:37

Use it when: Question says expressions are equivalent / true for all x and asks for a constant (a, b, k)

Type into Desmos
1<given expression with x1> ~ <other expression with x1>
2x_1=[1...10]
  1. Set the two equivalent expressions equal; change x to x1 and = to ~.
  2. On a new line type x1=[1...10] (or x1=random(10)).
  3. Read the constants (a, b...) from the regression results.

His example: Without the list it said b=1, which wasn't even an answer choice; the list forces a and b to stay the same for every x.

Trap: If you're solving for a constant, x1 should NOT appear with a single value in the results; that means you're doing it wrong. Use more x-values than the number of constants. Pick x-values that don't break the question (e.g. no negatives if x must be positive).

Regression without a table

23

Given solution: set x_1 to it

▶ 38:18

Use it when: "A solution to the equation is x = ___" plus unknown constants

Type into Desmos
1x_1=-22/7
2<left side> ~ <right side>
  1. A solution just means the x value that makes both sides equal.
  2. Type x_1 = that value (one number, no list).
  3. Type the equation in regression form: x becomes x_1, = becomes ~.
  4. Read the constant it asks for.

His example: 0 = (equation with k and t), k and t positive, solution x = -22/7 → set x_1=-22/7, read t (answer 23).

Trap: Only use a list like x_1=[1...10] when the question does NOT say what x equals.

24

Force conditions with curly braces

▶ 38:51

Use it when: "k is a positive constant", "p > 1", any condition the answer must meet

Type into Desmos
1<left side> ~ <right side> {k>0}
2<left side> ~ <right side> {p>1}
  1. Check each condition in the question against Desmos's constants.
  2. If one fails (k came out negative), add {k>0} at the end of the regression row.
  3. Every condition must be true, or the answer is wrong.

His example: k came out negative → added {k>0}; both constants positive, t read off.

Trap: If a constant breaks a condition (negative when it must be positive), that answer is wrong even though Desmos gave it.

25

Systems: bracket list regression

▶ 39:37

Use it when: Two or more equations share unknowns (system of equations, chained percent statements)

Type into Desmos
1[left side 1, left side 2] ~ [right side 1, right side 2]
2x_1^2+y_1^2
  1. Put ALL left sides in one bracket list, separated by commas.
  2. Put ALL right sides in a second bracket list, same order.
  3. Join with ONE ~ on ONE line.
  4. Type the expression the question asks for (e.g. x_1^2+y_1^2).

His example: Two equations (right sides 86 and 12) → one bracket regression → x_1^2+y_1^2 = 62.

Trap: Two separate ~ rows do NOT work, Desmos doesn't know it's the same x. Keep list order matched (86 first on both sides). Delete old separate regressions or x_1^2+y_1^2 gets confused.

26

Percent chains: "is" means =

▶ 42:32

Use it when: Hard percent word problems: "A is __% of B, B is __% of C... what is Q?"

Type into Desmos
1[X, X, Z] ~ [300% of Y, 0.05% of Z, Q% of Y]
2Q/10000
  1. Every "is" or "was" becomes an equal sign.
  2. Type each sentence word for word into the bracket lists.
  3. Use CAPITAL letters (X, Y, Z) so they act as constants, not lowercase x.
  4. Type what the question asks for, e.g. Q/10000.

His example: Object X is 300% of Y; X is 0.05% of Z; Z is Q% of Y; find Q/10000 → typed verbatim, Desmos solves in seconds.

Trap: About 2/3 of the hardest percent questions are this exact pattern. Don't think, just type what it says.

27

Check with L and R lists

▶ 43:59

Use it when: Any bracket (multi-equation) regression, especially when starting out

Type into Desmos
1L=[left side 1, left side 2]
2R=[right side 1, right side 2]
3L~R
  1. Type L = the list of left sides.
  2. Type R = the list of right sides.
  3. Regress L~R.
  4. Look at L and R: the items must match. If they don't, something is wrong.

His example: System with P, T, N: L~R, then compare L and R values to confirm both sides are equal.

Trap: You can't copy-paste on the real SAT, so type it as L and R the first time instead of retyping later.

28

Multi-equation: vary one variable by hand

▶ 44:31

Use it when: Several equations and "N is a constant" (so the other letters are variables)

Type into Desmos
1[left sides] ~ [right sides] {P>1}
2P=12
  1. Only the letter it calls "a constant" must stay fixed; the others are variables.
  2. Set ONE variable to a single number, e.g. P=12 (it must meet P>1).
  3. Change that number a few times by hand.
  4. If N never changes, it's the answer.

His example: Equations with P, T, N; P>1, T>1, N constant → N = 59/70, stays the same when P is changed.

Trap: P=[1...10] fails with "cannot store a list of numbers in a list" once you're inside brackets. Lists only work with ONE equation.

29

Ugly decimal = probably wrong

▶ 47:18

Use it when: Desmos returns a long messy decimal for the answer

  1. Click the decimal: a nice fraction or whole number is usually right.
  2. A long unconvertible decimal almost always means a missed step or condition.
  3. Recheck conditions before accepting it.

His example: N came out as 59/70, a convertible fraction, so it's probably right.

Trap: Sometimes an ugly decimal is still right. Only accept it if you're sure everything else checked out.

30

Don't over-define the variables

▶ 48:06

Use it when: After setting one variable to a number, you're tempted to set the others too

Type into Desmos
1P=12
  1. Set only ONE variable to a number.
  2. If L and R stop matching, you gave Desmos an impossible situation.
  3. Delete the extra definition (e.g. T=2).

His example: P=12 and T=2 together have no solution → sides no longer equal; remove T=2 and everything checks out again.

Trap: Too much information makes the problem impossible to solve, and Desmos gives a wrong answer.

31

Constant changes? Make one equation

▶ 50:17

Use it when: Hardest type: constant changes when you change x, even with bracket regression

Type into Desmos
1P=6-Q
2x_1=[1...10]
3<single equation> ~ <right side>
4r=22
  1. Solve the simple second equation for one letter (P+Q=6 → P=6-Q).
  2. Now there's only one regression equation, so use x_1=[1...10].
  3. If needed, plug each answer choice for r and see if both sides match.

His example: P+Q=6 rewritten as P=6-Q; x_1=[1...10] → r=22; testing choices: r=2 and r=7 fail, 22 and 26 work → answer C.

Trap: Rare and very hard. Skip it if time is short.

Regression with a table

32

Points anywhere means use a table

▶ 53:22

Use it when: Graph with points, listed points, or function notation like f(2)=8

Type into Desmos
1table
  1. Type "table" or press + then table.
  2. Enter every known point: f(2)=8 means (2, 8).
  3. Table regression is about 10% of SAT math (no-table regression about 18%).

His example: f(2)=8 and f(1)=4 → table rows (2, 8) and (1, 4).

33

Never graph the unknown point

▶ 54:12

Use it when: One of the points holds the thing you're solving for (e.g. (k, 0))

Type into Desmos
1c=2
  1. Put only the known points in the table.
  2. Leave out the point you're solving for; Desmos can't solve inside a table.
  3. A point with a letter you're NOT solving for is fine: define it first (c=2).

His example: Asked for k in (k, 0) → leave that row out. Points with c when solving for b → set c=2 and keep them.

Trap: Desmos won't graph a point whose letter is undefined, so give it any value first.

34

Dropdown regression when form matches

▶ 54:55

Use it when: The equation's form matches a preset (a·b^x, linear, standard quadratic)

Type into Desmos
1y_1~ab^{x_1}
  1. Enter the points in the table.
  2. Click the regression dropdown (graph icon) and pick the type, e.g. exponential.
  3. Check the preset has the same form as the question's equation.
  4. Read the constant (b = base).
Desmos screen for Dropdown regression when form matches
What your Desmos screen looks like (example numbers)

His example: f(x)=a·b^x with f(2)=8, f(1)=4 → exponential regression → b = 2.

Trap: If the question's form differs from the preset (e.g. b^x minus something), the preset gives weird decimals, so use a custom regression.

35

Custom regression in 3 steps

▶ 55:44

Use it when: Question gives points AND the equation that goes through them

Type into Desmos
1x_1 | y_1 (table of known points)
2c=2
3y_1~<equation with x_1 in place of x>
  1. Step 1: type the points in a table.
  2. Step 2: type the equation it gives you.
  3. Step 3: change to regression form: y→y_1, x→x_1, =→~.
  4. Read the constant; drag any free slider (c) to confirm it doesn't change.

His example: Exponential of form b^(...) minus a number through points with c (like (c, 8) and (2c, 350)) → set c=2 → b = 11, stays 11 as c moves.

Trap: Most of the time the question literally tells you the equation. Type it; don't pick a preset that doesn't match.

36

Memorize circle and vertex form

▶ 57:43

Use it when: Points given but NO equation: "passes through a circle" or "maximum/minimum"

Type into Desmos
1(x_1-h)^2+(y_1-k)^2~r^2
2y_1~a(x_1-h)^2+k
  1. Circle: (x-h)^2+(y-k)^2=r^2, center (h, k), radius r.
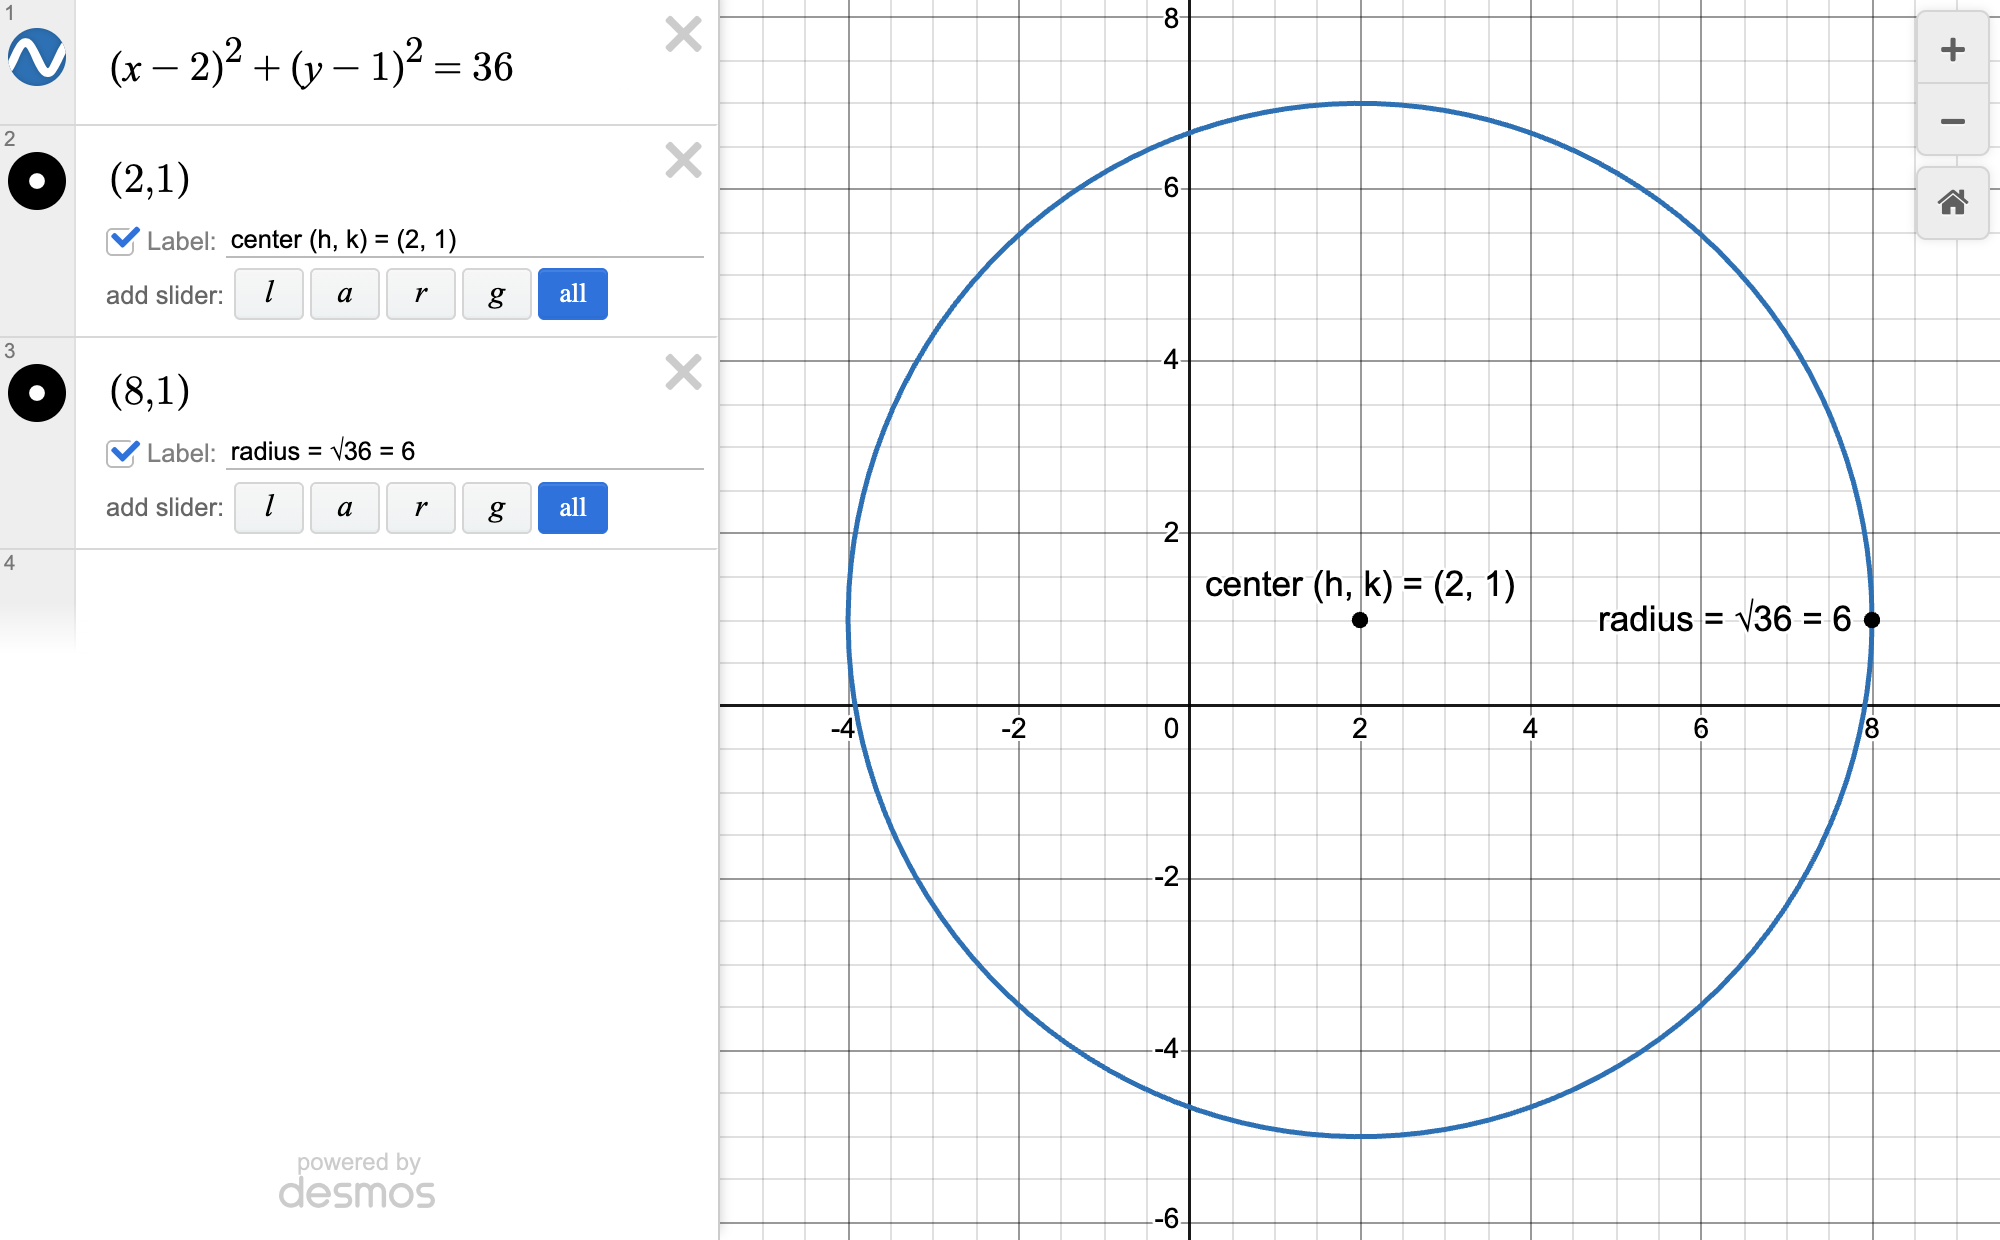
  2. If the right side is 36, radius = √36 = 6.
  3. Vertex form: y=a(x-h)^2+k, vertex (h, k) = max or min.
  4. Every other type is in the dropdown menu.
Desmos screen for Memorize circle and vertex form
What your Desmos screen looks like (example numbers)

His example: "= 36" on the right side means radius 6.

Trap: These are the ONLY two equations you must memorize.

37

Circle through points

▶ 59:45

Use it when: "A circle passes through these points... find k" where one point is unknown

Type into Desmos
1x_1 | y_1 (the 3 known points)
2(x_1-h)^2+(y_1-k)^2~r^2
  1. Table: the three known points only (skip the one with k).
  2. Type the circle equation in regression form.
  3. Desmos finds h, k, r.
  4. Find where the circle hits y = 0 to get the missing x.

His example: Three points given, 4th point (k, 0) left out → circle regression → read x where the circle crosses y = 0.

Trap: The regression won't DRAW the circle (not in y= form). To see it, duplicate the row and change it back to normal = form.

38

Vertex form for max/min

▶ 61:55

Use it when: Word problem says "maximum height" / "minimum" and it's a quadratic

Type into Desmos
1x_1 | y_1: (0, 4)
2y_1~a(x_1-2)^2+20
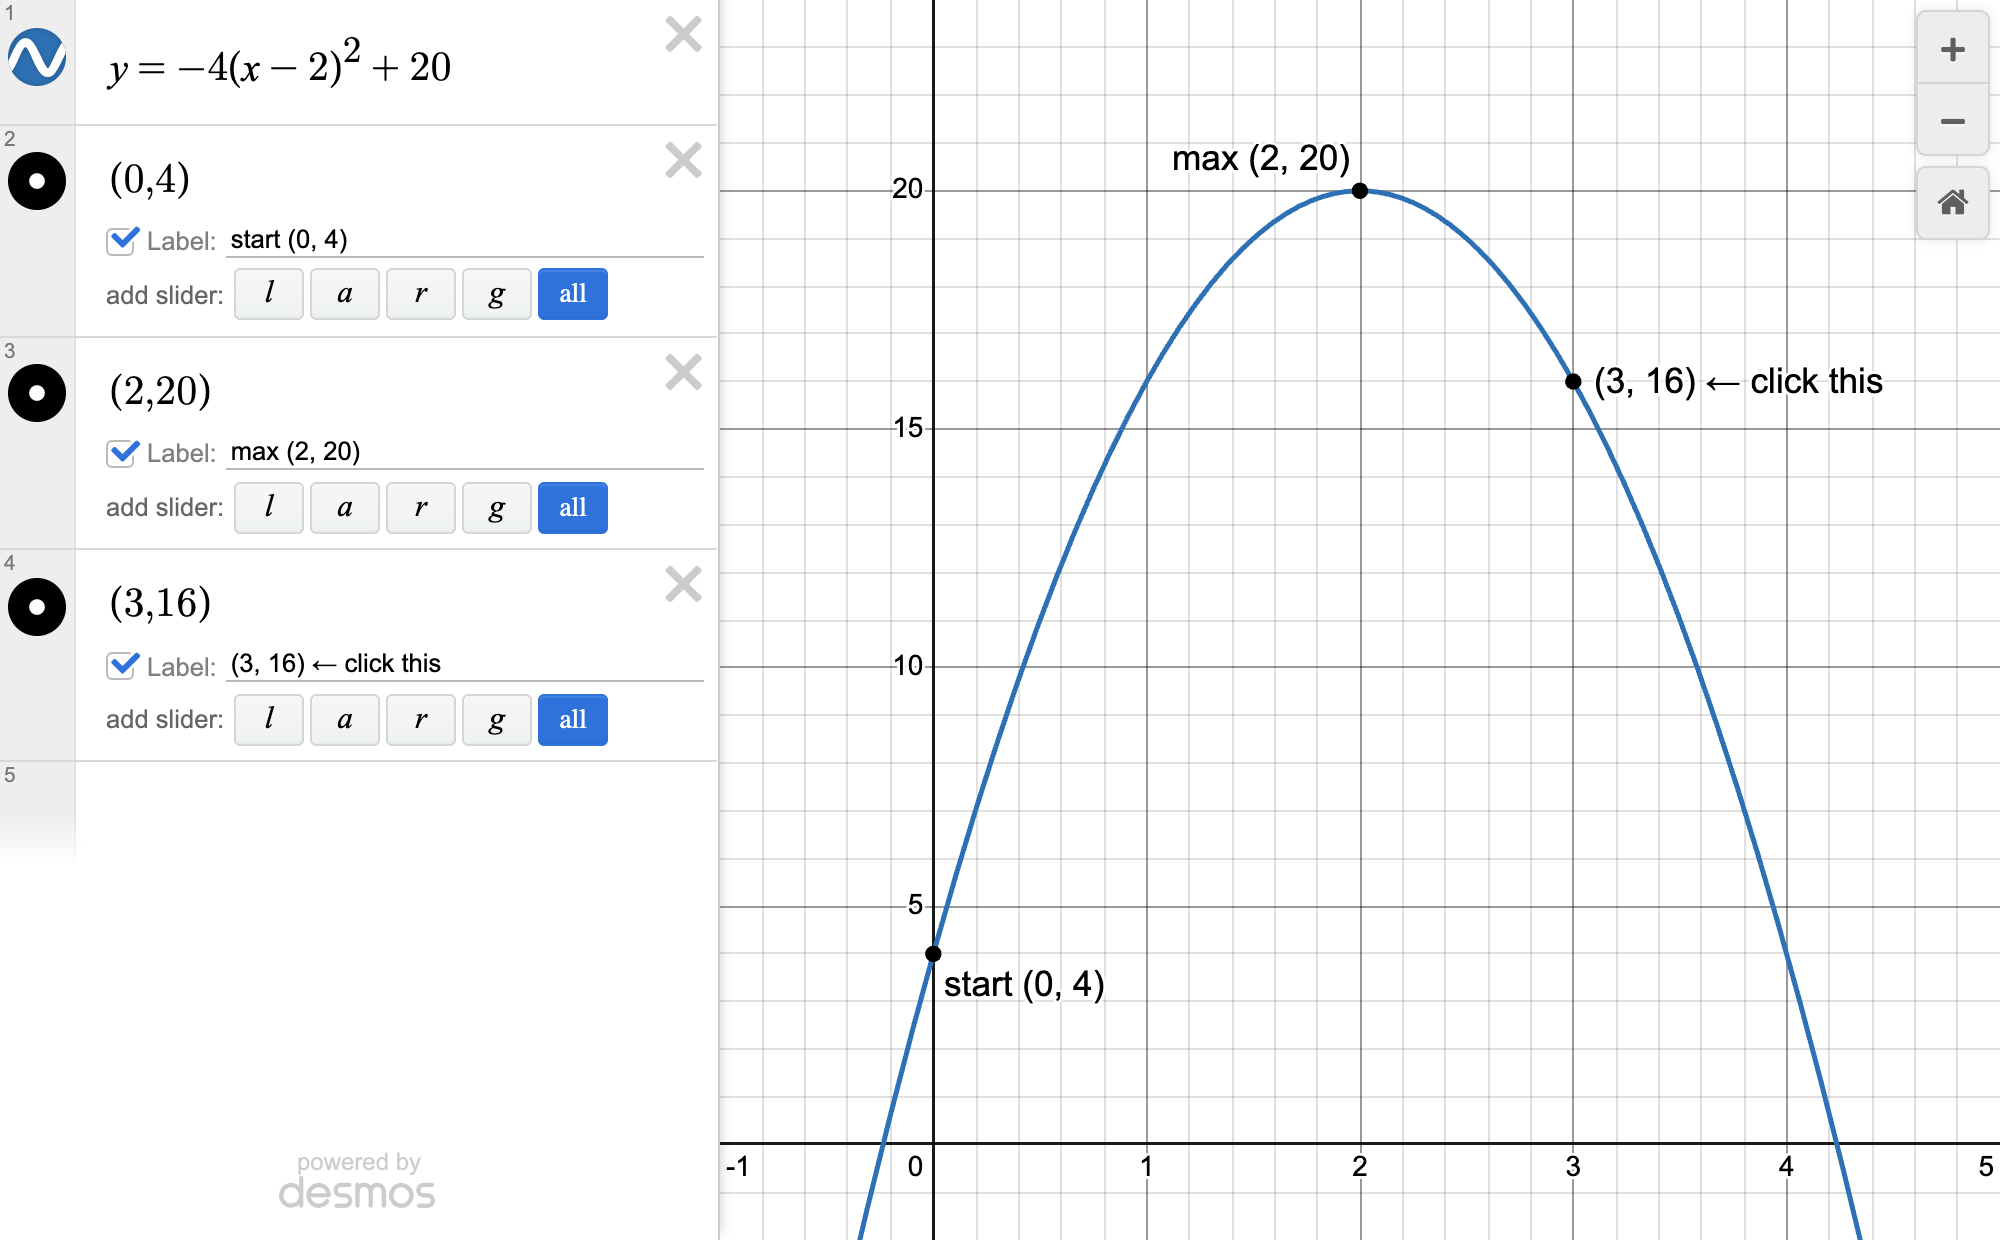
  1. Turn the words into points: starts at 4 ft = (0, 4).
  2. Max 20 ft after 2 s = vertex (2, 20), so h=2, k=20.
  3. Regress y_1~a(x_1-2)^2+20 using the other point.
  4. Click the graph at the x it asks for.
Desmos screen for Vertex form for max/min
What your Desmos screen looks like (example numbers)

His example: Ball starts at 4 ft, max 20 ft at 2 s → a = -4 → height at 3 s = 16.

Trap: Plain quadratic regression on (0,4),(2,20) gives the wrong curve: (2,20) isn't a maximum. Plug in the vertex.

39

Points needed = constants to find

▶ 63:34

Use it when: Picking points off a graph for a regression, or regression gives a wrong curve

  1. Count the unknown constants (ax^2+bx+c has 3).
  2. You need at least that many points.
  3. Fewer points means infinite answers, so Desmos gives a wrong one.
  4. Fix: plug in known values (like the vertex) to cut constants.

His example: Standard quadratic needs 3 points but ball question gave 2 → vertex form leaves 1 constant (a), 1 extra point is enough.

Trap: Exception: standard-form line ax+by=c never works this way (see next).

40

Standard-form line: fix one constant

▶ 65:30

Use it when: Answer choices look like ax + by = c (line in standard form)

Type into Desmos
1s=6.4
23x_1+by_1~c
  1. Answer choices show which numbers change: in front of x, y, and after =.
  2. Give any unknown letter a value (s = any number) so it can graph.
  3. Set one coefficient to a value from a choice, e.g. 3 in front of x.
  4. Solve the rest; keep the choice where every part matches.

His example: Put 3 in front of x → b = 6.4 = s and c = 11s → choice B (3x + sy = 11s). Choice A failed: its x-coefficient should equal s but didn't.

Trap: ax+by=c with all three unknown has infinite answers, and Desmos bugs out no matter how many points you add.

41

Bad fit? Add +0.0001

▶ 69:42

Use it when: Question says the equation contains the points, but the regression misses them

Type into Desmos
1y_1~<equation in regression form>+0.0001
2y_1~<equation in regression form>-0.0001
  1. Always check: curve through every point, and R² = 1 under statistics.
  2. If not, add +0.0001 to the end of the regression.
  3. Still broken? Try -0.0001 instead.
  4. Zoom out before reading the answer.
Desmos screen for Bad fit? Add +0.0001
What your Desmos screen looks like (example numbers)

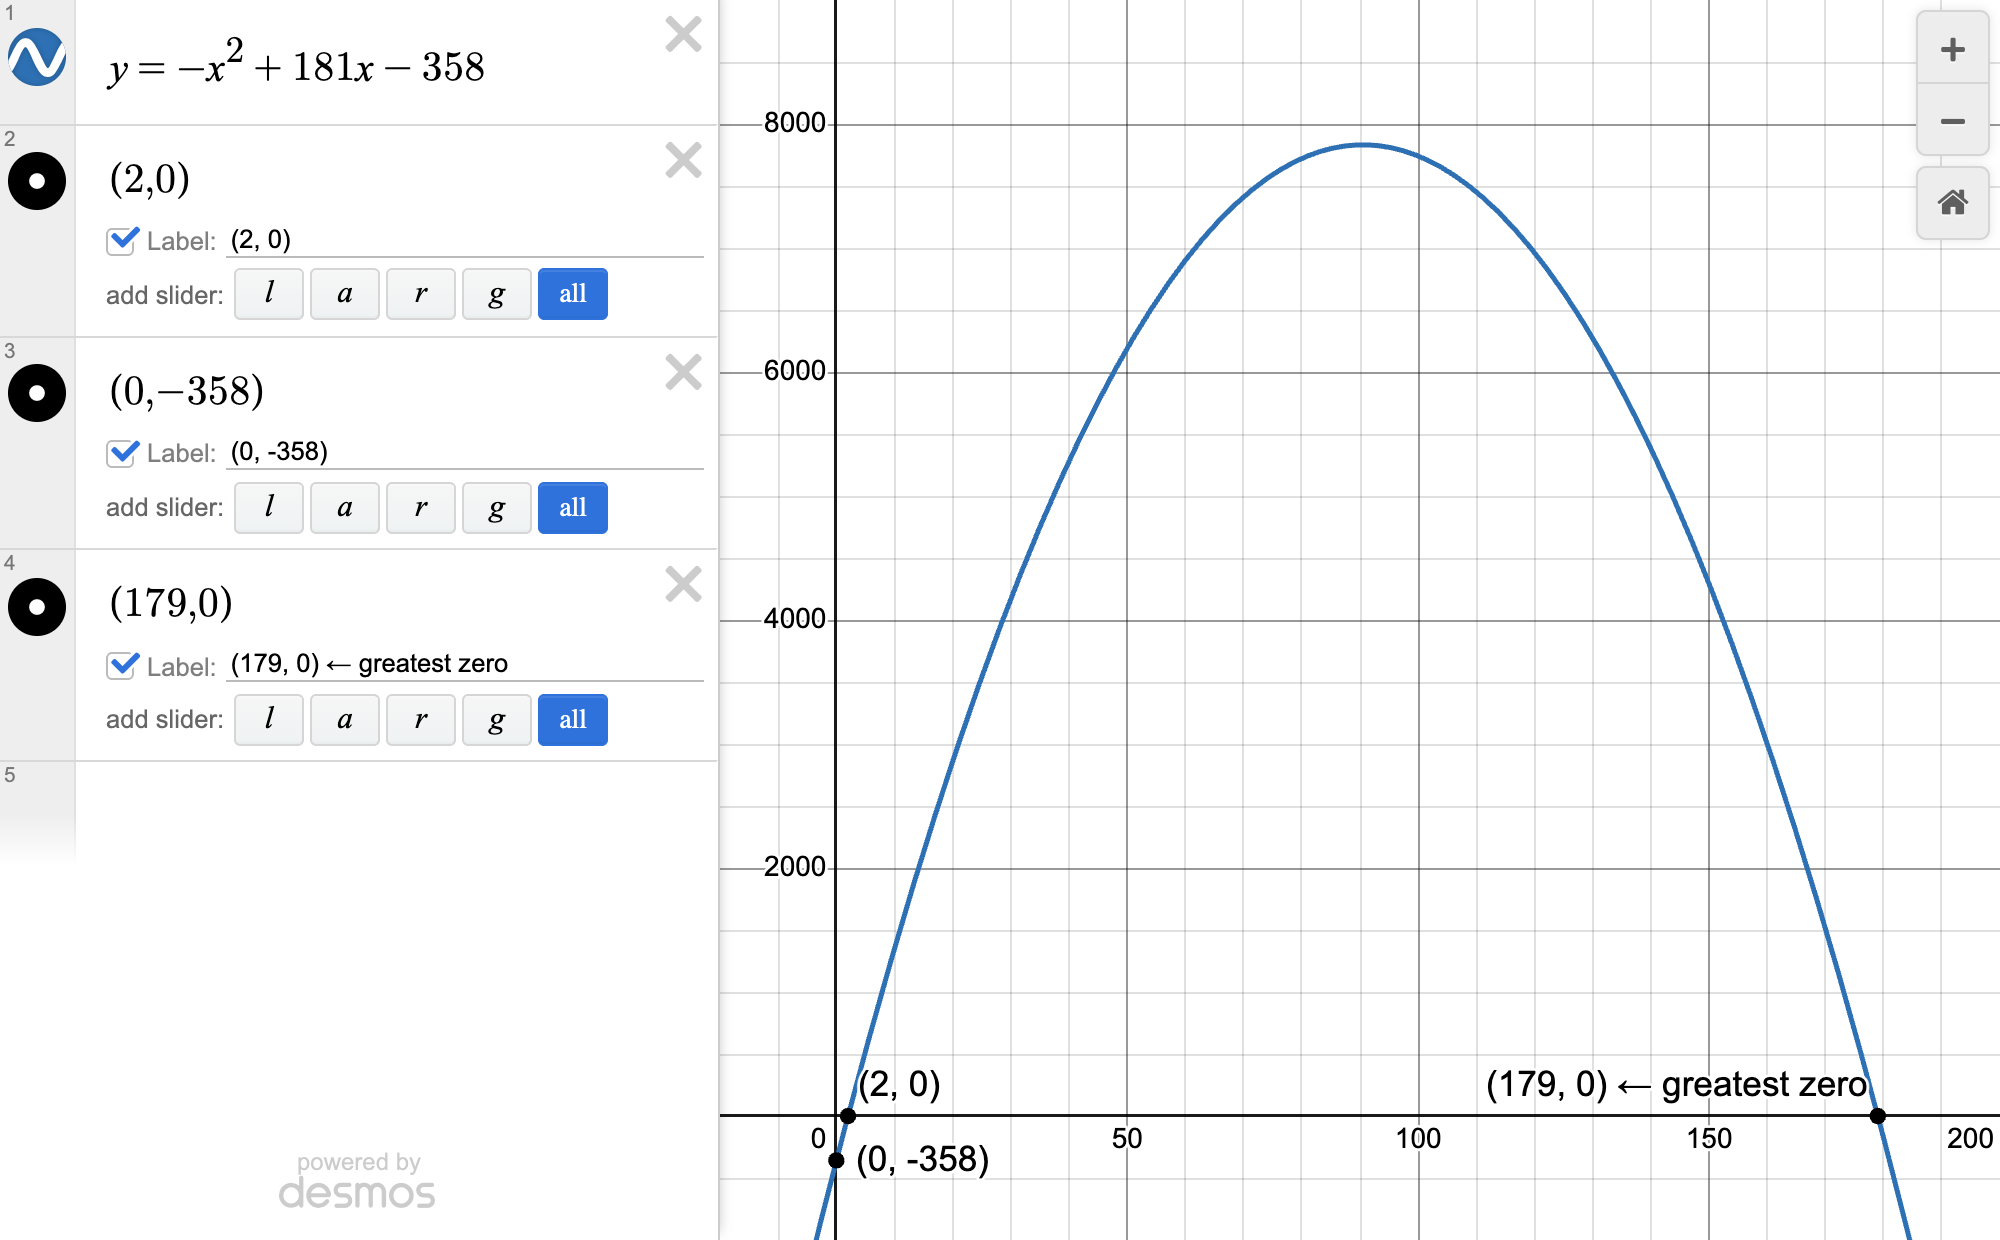
His example: Quadratic with b, c through (2, 0) and (0, -358) missed the points → add 0.0001 → fits; greatest x with y=0 is 179 (zoom out).

Trap: "Greatest possible value" hints the answer is far out. If you only see 1, zoom out.

42

Table = x_1, y_1 lists

▶ 73:00

Use it when: Regression ignores your table, or you added a second table

Type into Desmos
1x_1=[2,0]
2y_1=[0,-358]
3y_1~<equation with x_1>
  1. A table is just the lists x_1=[...] and y_1=[...].
  2. The letters in your regression must match the table headers.
  3. A second table becomes x_2, y_2; a third x_3, y_3.
  4. Using table 2? Write x_2 and y_2 in the regression.

His example: Table with (2, 0), (0, -358) is identical to typing x_1=[2,0] and y_1=[0,-358].

Trap: Wrong subscript (x_1 vs x_2) and Desmos won't pull the points; it tries to solve for that letter instead.

43

Defined constants won't be solved

▶ 75:25

Use it when: Regression won't give a value for the letter you want

  1. Check if you already set that letter earlier (e.g. b=9).
  2. Regression only solves UNKNOWN constants.
  3. Delete the old definition or use a new letter.

His example: Earlier row said b=9 → regression won't find b.

Trap: Leftover rows from an earlier question block the regression. Clear them.

Regression

44

Regression letters must be undefined

▶ 76:01

Use it when: You're using ~ regression to solve for a constant that already has a value elsewhere in Desmos

Type into Desmos
1[left side] ~ [right side] (use b_1 or p instead of a b already defined)
  1. The letter you want solved must have NO value set anywhere.
  2. If b is already used, rename it b_1 or any unused letter like p.
  3. Then Desmos finds the value that makes both sides equal.

Trap: If b already equals 2 somewhere, ~ treats it as 2 and will NOT solve for it.

Isolation problems

45

Isolation: plug-in numbers check

▶ 76:50

Use it when: "Which equation correctly expresses R in terms of P, Q, and F?" (get one letter by itself)

Type into Desmos
1[given equation, with = changed to ~]
2p=2
3q=7
4f=3 (any other letter: a different number, not 0 or 1)
5[answer choice's right side] → compare to r
  1. Type the given equation, swap = for ~.
  2. Give every other letter a different number (never 0 or 1). Desmos solves r.
  3. Type an answer choice's expression and see its value.
  4. The choice whose value equals r is right.

His example: R in terms of P, Q, F: with p=2, q=7, regression gave r = 0.74...; choice C gave a different number, choice B gave 0.74 → B.

Trap: 0 and 1 don't change when squared or square-rooted, so wrong choices can match. Also: wrong choices are built from common algebra slips, so spend ~30 sec verifying your mental algebra.

Regression recap

46

When regression works

▶ 81:22

Use it when: An expression equals an expression, OR the question gives points (or a graph you can read points from)

Type into Desmos
1[expression] ~ [expression]
2table of points x_1, y_1 → y_1 ~ [model]
  1. Expression = expression anywhere in the question → ~ regression.
  2. Points given or readable from a graph → table + regression.
  3. Multiple equations → bracket regression.

Trap: Regression gives ONE value, so never use it for multiple-solution questions.

Pattern: systems

47

System of equations: graph it

▶ 81:57

Use it when: Two equations in x and y; asks for x, y, or something like x − y

Type into Desmos
1[equation 1]
2[equation 2]
  1. Type both equations as-is.
  2. Click the intersection point: that's (x, y).
  3. Compute what it asks, e.g. x − y.

His example: His personal first-pass method; bracket regression also works, graphing feels safer and is just as fast.

Pattern: multiple solutions

48

Sum/greatest of solutions: graph

▶ 83:21

Use it when: "Sum of the solutions", "greatest solution", "least possible solution"

Type into Desmos
1[the equation in x only] → shows vertical lines
2a=[first x-value]
3a+[second x-value]
  1. Graph the one-variable equation: each vertical line is a solution.
  2. Click each line to read its x-value.
  3. Add them (or pick the biggest/smallest).
Desmos screen for Sum/greatest of solutions: graph
What your Desmos screen looks like (example numbers)

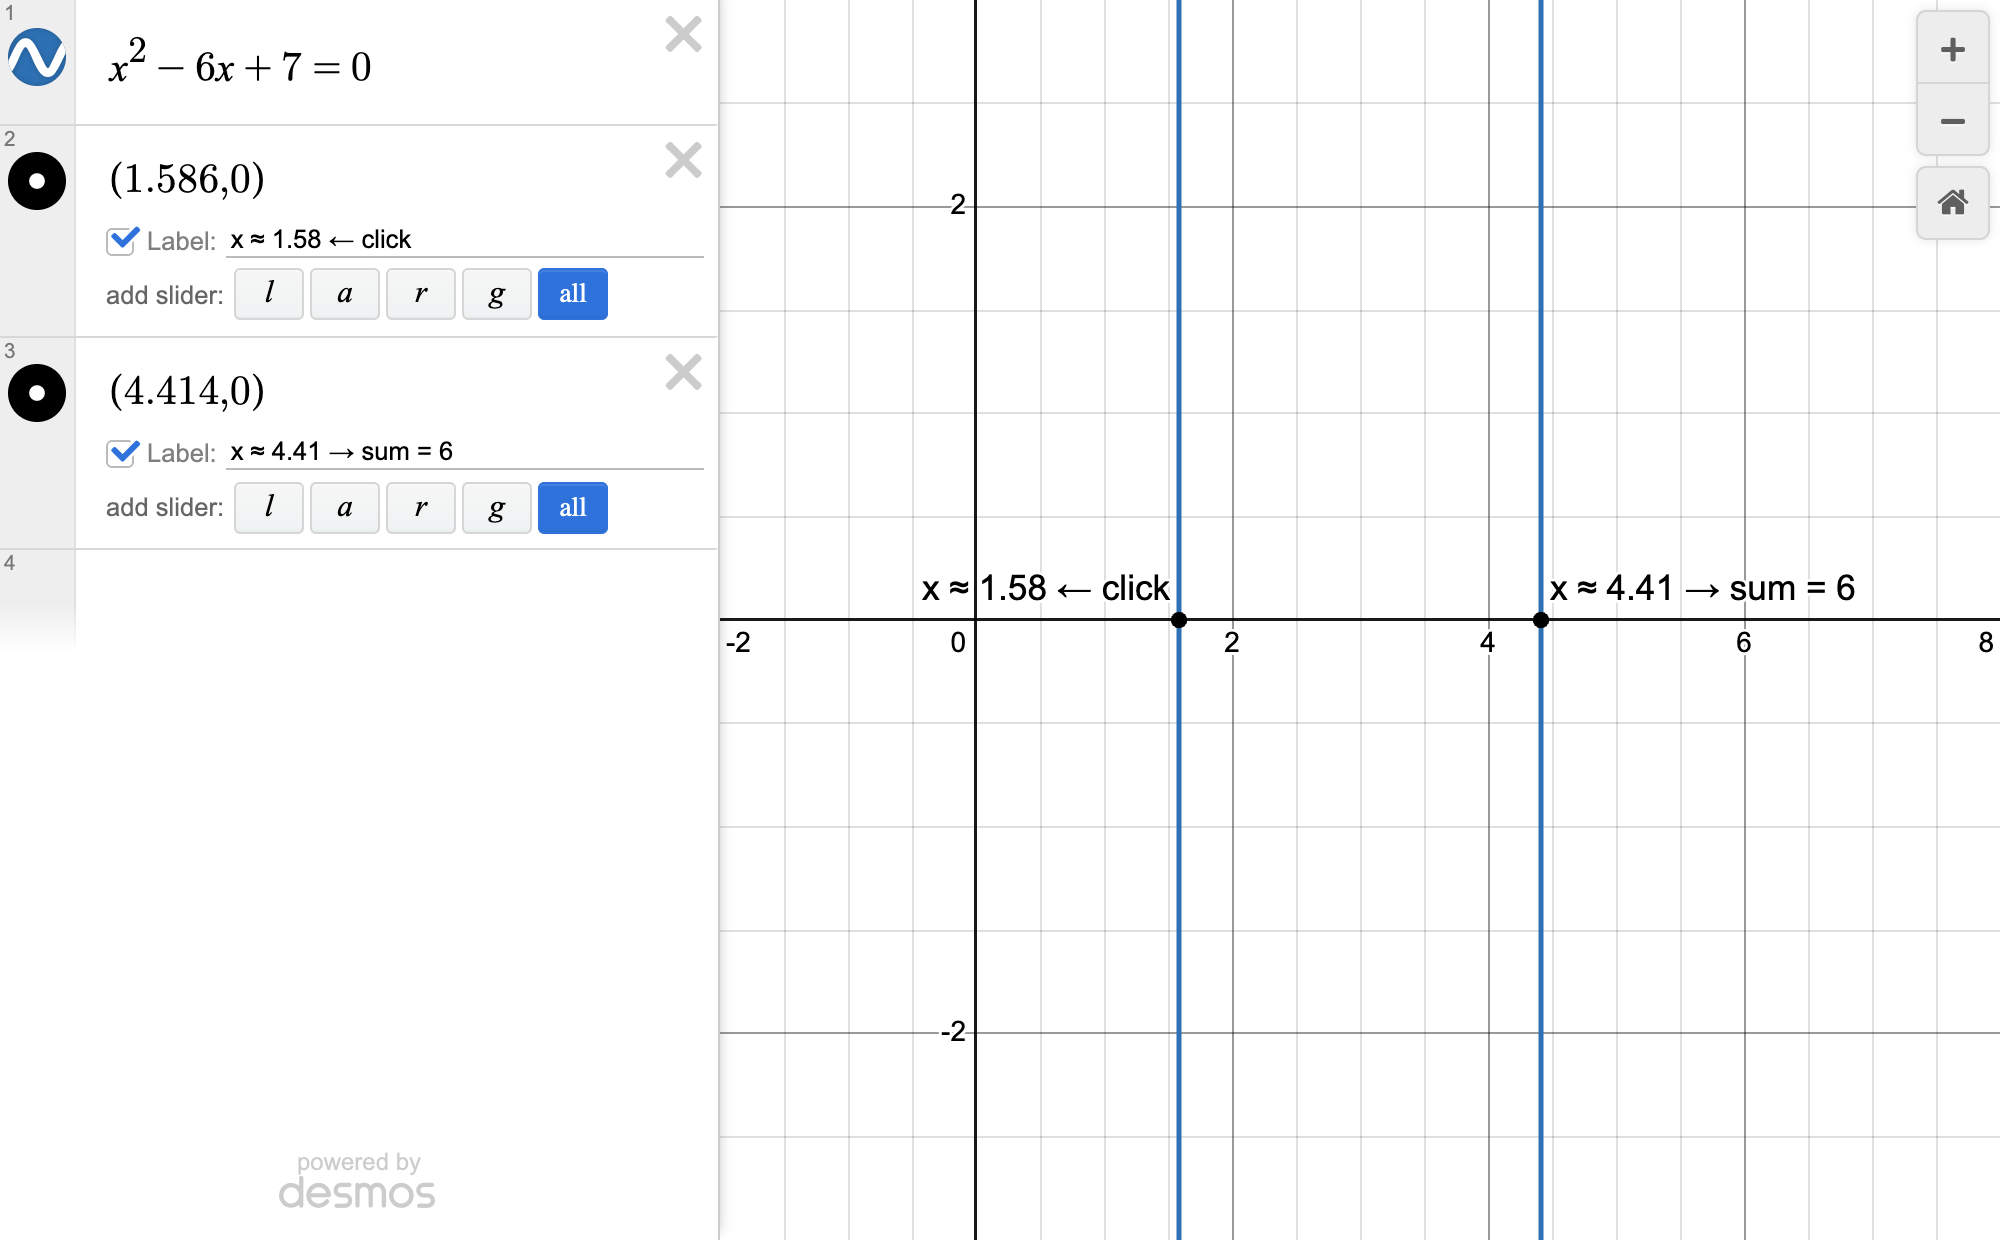
His example: Solutions at x ≈ 1.58 and the other line; he set a = one value and typed a + the other → sum = 6.

Trap: Don't use regression: it only finds one value.

Pattern: number of solutions

49

Count solutions = count crossings

▶ 84:38

Use it when: "How many solutions" / "exactly one solution" / answer choices like 0, 1, 2, infinitely many

Type into Desmos
1y=[left side of =]
2y=[right side of =]
3a=0 (plug in any value the question gives)
  1. A solution is where the two graphs cross.
  2. Graph both sides, count the crossings.
  3. Zoom in where they barely touch.

His example: With a = 0 the graphs only touch once (just brushing) → exactly one solution, choice C.

Pattern: no solutions

50

No solutions: lines never touch

▶ 85:24

Use it when: "For what value of k does the system/equation have no solution?"

Type into Desmos
1y=\frac{1}{4}x
2y=cx+2
3c=0.25 (type values, don't drag the slider)
  1. Graph both sides as separate lines.
  2. Type each answer choice for the constant instead of dragging a slider.
  3. No answer choices? Test values: 0.2 tilts one way, 0.3 the other → try 0.25.
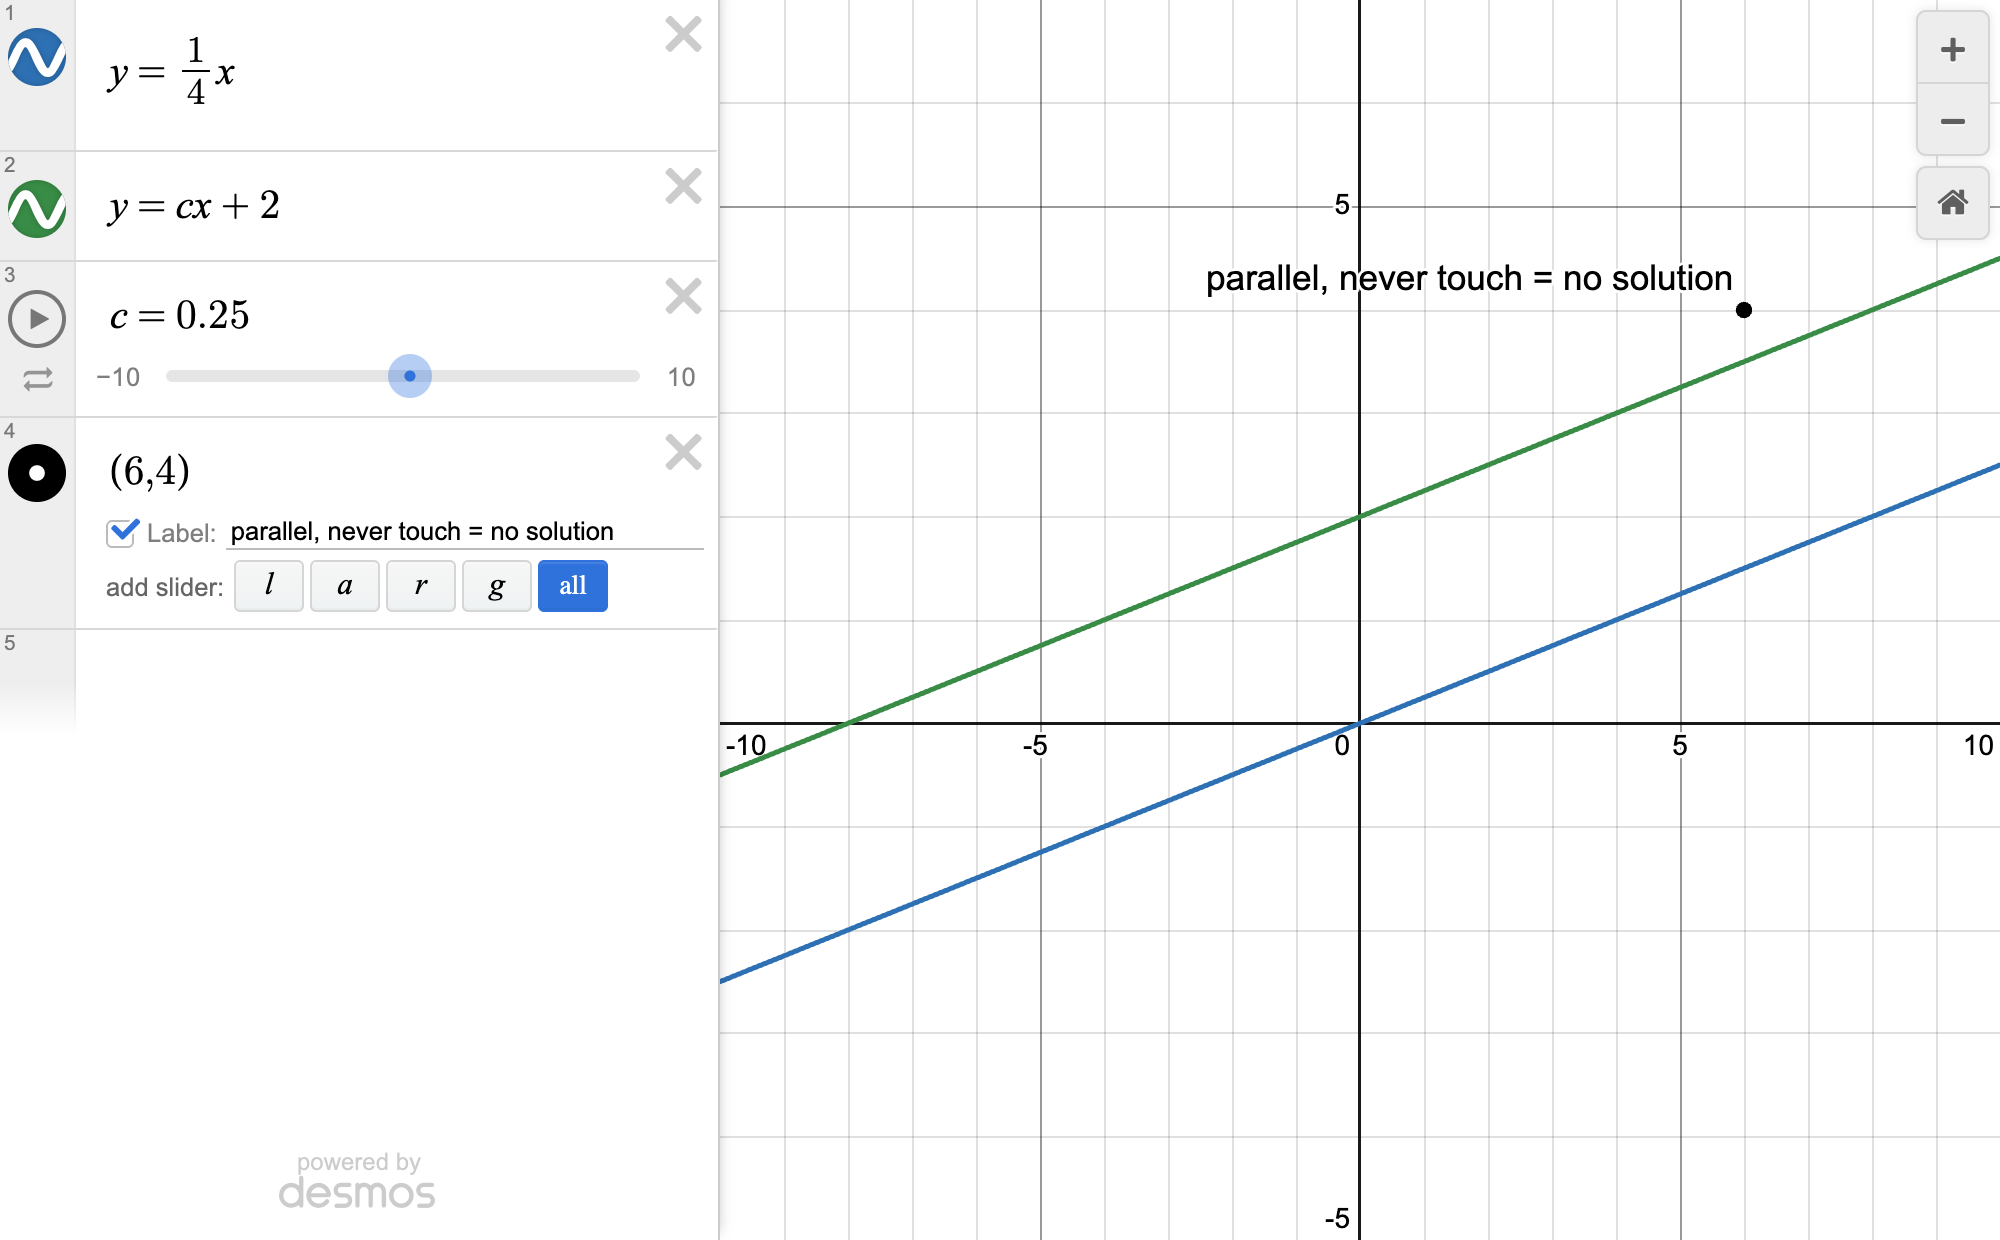
  4. Zoom way out and in: parallel, never closing = no solution.
Desmos screen for No solutions: lines never touch
What your Desmos screen looks like (example numbers)

His example: k = 12/5 made the lines parallel → answer. And 1/4x = cx + 2: c = 0.25 (1/4) never touches → no solution.

Trap: Zoomed out, two parallel lines can look like one line (infinite solutions). Zoom in to check.

Pattern: number of solutions

51

Always split into two lines

▶ 86:22

Use it when: ANY question about the NUMBER of solutions (none, one, infinite, how many)

Type into Desmos
1y=[everything left of =]
2y=[everything right of =]
3y=0 (if one side is just a number, still give it its own line)
  1. Split the equation at the equals sign.
  2. Left side on one line, right side on another, each with y=.
  3. A lone constant still gets its own line (y=0).
  4. Now you can see the crossings and what sliders do.

Trap: On ONE line, no-solution and infinite-solution equations look identical (nothing graphs). Also one-line sliders are unreadable.

Pattern: infinite solutions

52

Infinite solutions: use regression

▶ 89:55

Use it when: The question SAYS the equation has infinitely many solutions and asks for a constant

Type into Desmos
1x_1=[1,2,3]
2[left side with x_1] ~ [right side with x_1]
  1. Infinite solutions = both sides are the exact same graph.
  2. Make x_1 a list of numbers.
  3. Write left ~ right with x_1 in place of x.
  4. Read the constant Desmos finds.

His example: Infinitely many solutions for x, find b → regression gives b = 2.5.

Trap: Only when infinite solutions is GIVEN. Not for no solution, one solution, or 'how many solutions' questions.

Pattern: circles

53

Circle radius: max to min

▶ 91:24

Use it when: Given a circle equation, asks for the radius (or diameter)

Type into Desmos
1[circle equation]
2a=([top point])
3b=([bottom point])
4distance(a,b)/2
  1. Graph the circle; click the TOP (max) and BOTTOM (min) points.
  2. Save them as a= and b=.
  3. distance(a,b) is the diameter; divide by 2 for radius.
Desmos screen for Circle radius: max to min
What your Desmos screen looks like (example numbers)

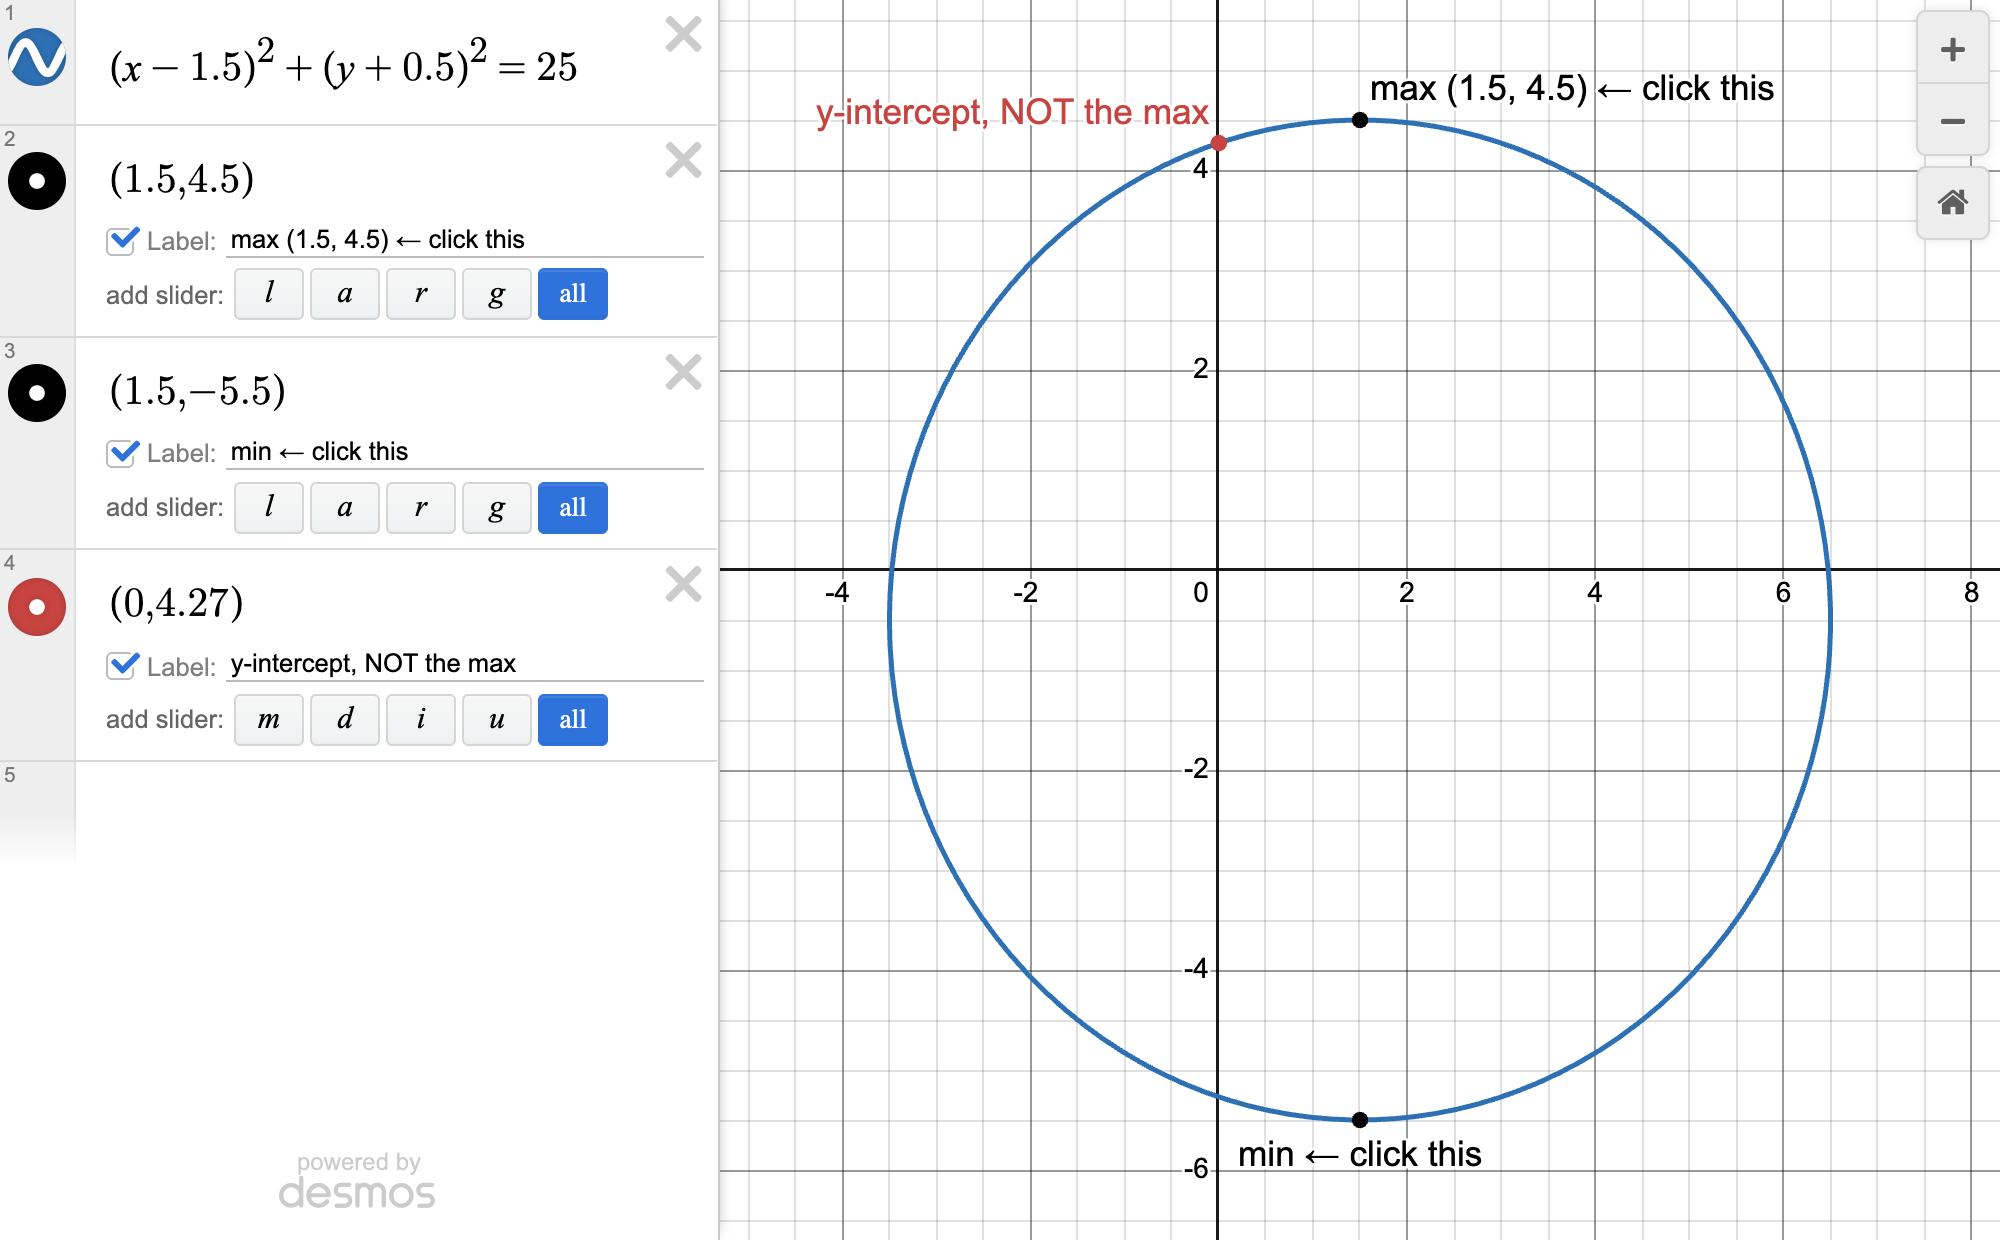
His example: distance between max and min = 10 (diameter) → radius = 10/2 = 5.

Trap: Don't use the left/right points (they hide on the x-axis). Don't mistake the y-intercept (y ≈ 4.2) for the max (y = 4.5).

54

Circle center + inside points

▶ 93:00

Use it when: Asks for the center, or which point is inside the circle

Type into Desmos
1a=([top point])
2b=([bottom point])
3midpoint(a,b)
4([answer choice point])
  1. Center: same max/min points, type midpoint(a,b).
  2. Inside/outside: type each answer-choice point and look.

His example: An answer-choice point plotted outside the circle → not the answer.

Pattern: equivalent expressions

55

Equivalent expressions: overlap test

▶ 93:51

Use it when: "Which expression is equivalent to..." (any expression, pick the matching choice)

Type into Desmos
1y=[given expression]
2y=[answer choice]
  1. Put y= in front of the given expression.
  2. Put y= in front of each answer choice too.
  3. The choice that sits exactly on top is equivalent.
  4. Toggle it on/off to confirm.

His example: Guessed C with algebra, typed y=2x^2y+2xy^2 → exactly on top of the given → C.

Trap: If the expression contains y, Desmos errors without an = sign. Fix: start every line with y=.

56

Constants: never 0 or 1

▶ 95:28

Use it when: Expression has a constant (a, k...) or you add any slider

Type into Desmos
1a=2
2y=[given expression]
3y=[answer choice with a]
  1. Set the constant to any number that isn't 0 or 1 (he uses 2).
  2. Then compare graphs.
Desmos screen for Constants: never 0 or 1
What your Desmos screen looks like (example numbers)

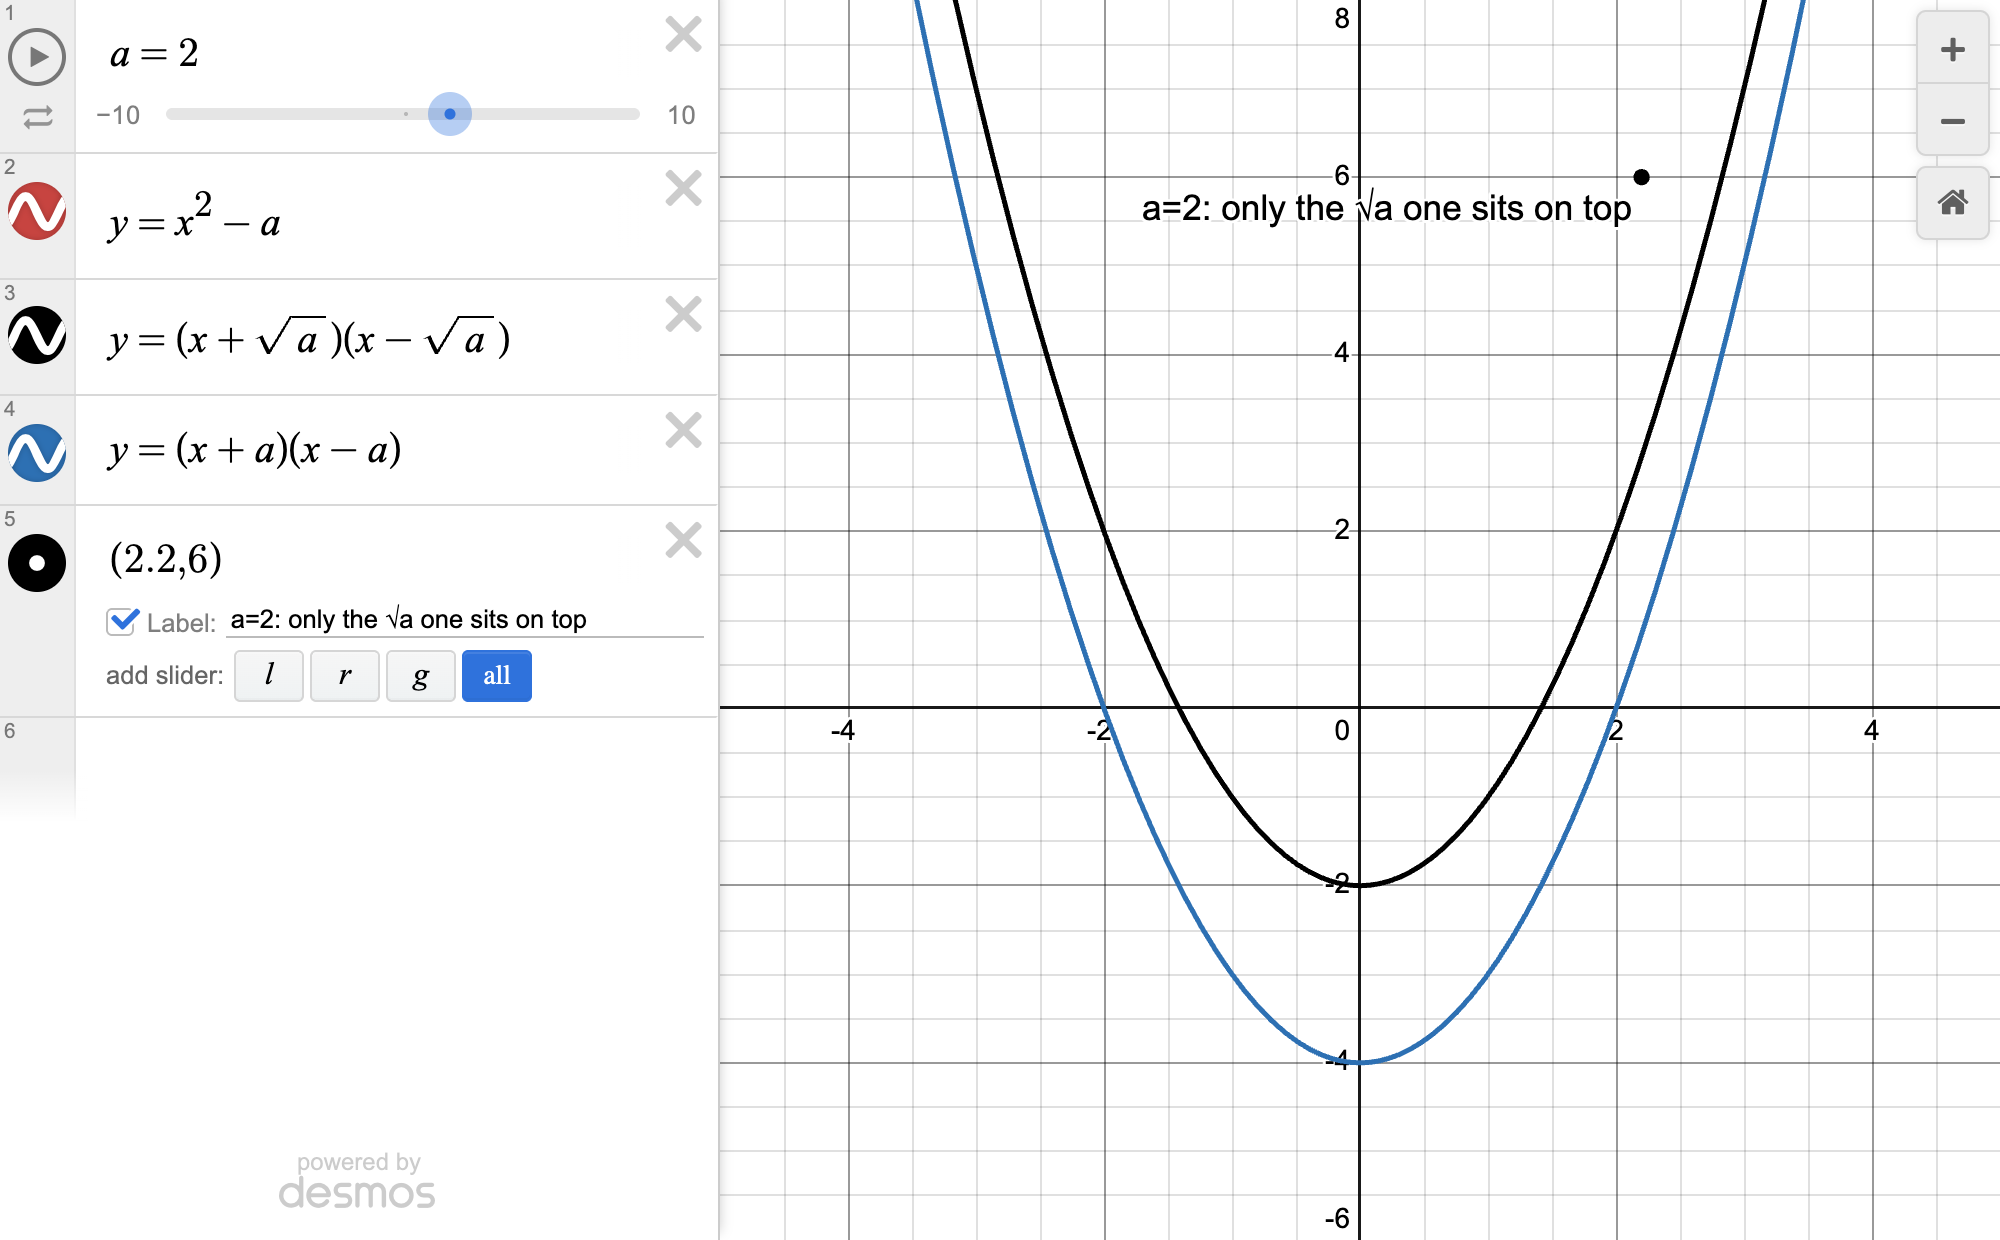
His example: Given x² − a: with a = 1, both (x+a)(x−a) and (x+√a)(x−√a) sit on top. With a = 2 only (x+√a)(x−√a) matches → B.

Trap: Desmos's default slider value is 1: change it. With a = 1, wrong choices can look identical.

Pattern: factors

57

Factor questions: same x-intercept

▶ 97:08

Use it when: "Is ___ a factor of ___" / "divisible by"

Type into Desmos
1y=[expression]
2y=[possible factor]
3n=[answer choice]
  1. A shared factor means a shared x-intercept.
  2. Graph both; type each answer choice for the constant.
  3. The choice that makes the x-intercepts line up is right.

His example: Find n: negative choices moved it farther away; n = 29 (choice D) gave the same x-intercept → D.

Flowchart

58

Flowchart: graph or regression?

▶ 98:33

Use it when: Deciding which Desmos method to use on any question

  1. Equation (especially with points)? Desmos can likely do it start to end.
  2. Regression works for almost any expression = expression, but isn't always worth it.
  3. Just graph: basic graphing, inequalities, easy circles, number of solutions, equivalent, factors.
  4. Isolation → isolation process. Points → table regression. Several equations → bracket regression.

His example: Circle radius CAN be done by regression (r came out 5), but graph + distance ÷ 2 is faster.

59

Basic graphing and f(2)

▶ 100:30

Use it when: Asks the y-intercept, y when x = 2, or f(2), and there's no extra = sign besides defining f

Type into Desmos
1f(x)=[given definition]
2f(2)
  1. Type the function exactly as given.
  2. Type f(2) (or read the point off the graph).
  3. Only use regression if the question has another = sign besides the definition.
60

When x_1 needs a list

▶ 104:24

Use it when: Using regression and not sure whether x needs to be a list

Type into Desmos
1x_1=[1,2,3]
  1. Is it asking for a CONSTANT's value (e.g. positive constant t)? Use the list.
  2. Asking for x or 'the solution'? No list: let Desmos find x.
  3. Question already gives a solution (x = a number)? No list: x isn't varying.

His example: "What is the value of t" where t is a positive constant → list. A question that states a solution for x → don't use the list.

Desmos theory

61

Meet every condition, then trust it

▶ 105:32

Use it when: A scary question with lots of constants and no pattern you recognize

Type into Desmos
1q(x)=[given definition]
2b=88
3a=89
4h=q(639)
5k=q(621)
6[the expression it asks for]
  1. List every condition in the question.
  2. Pick any numbers that satisfy them (a > b > 87 → b = 88, a = 89).
  3. Define each named value: constant on the LEFT (h=q(639)).
  4. Type what it asks; the result is the answer.

His example: a > b > 87, q(639) = h, q(621) = k → answer 630, no matter if a is 89 or 1 billion. Regression (q(639) ~ h, q(621) ~ k with a > b > 87 told to Desmos) also gives 630.

Trap: Type h=q(639), not q(639)=h. When defining a constant, the constant goes on the left.